
What, how, and when: Personalizing commercial offers with AI
In recent years, e-commerce has grown exponentially. We as a society have embraced this new way of shopping due to its ease and immediacy. BBVA is no exception; in fact, 79% of our sales were digital last year.1
In this context, where information, supply, and choice are multiplying, it makes sense to adopt an approach based on personalizing commercial offers with AI. Products and services tailored to each customer’s needs, along with when and how they need them, will be more successful than general offers that are not personalized.
Artificial intelligence is assisting us in processing a large amount of data, thereby enhancing the personalization of our offers.
Commercial offers with AI, from expert criteria to data and algorithms
For decades, commercial campaigns were designed based on expert criteria and limited datasets from which target audiences were identified. This process involved creating and launching unscalable, static campaigns.
A couple of years ago, if we wanted to launch a campaign to offer an account for minors, we would have used the bank’s available data to find insights that would help us identify the target audience for that product. For example, we could have looked for people aged 20 to 40 with direct debit bills from schools, daycare centers, or extracurricular activities. We would have used this information to configure the target audience for the commercial offer and create the advertising message.
This approach has limitations as it fails to consider individual factors. To address this, BBVA has developed a commercial product recommendation system that provides real-time offers. These messages are tailored using data from various sources and machine learning models.
Technology combined with expert judgment allows us to analyze thousands of variables, detect more precise audiences, and discover new potential customers.
To achieve this, we follow a series of steps, which together define our digital sales pipeline.
But, before delving into our pipeline, it is important to understand two concepts that play a fundamental role in the process: experimentation and feature engineering.
Continuous experimentation as a way of learning
The default methods to discover the best message for a specific audience are A/B testing and market research. Today, technology enables us to move from a “one size fits all” approach to customizing the message for each customer, channel, and moment. Furthermore, we can continually experiment and use the results to refine our offers (or their absence) and provide the best service to all customers.
A/B tests compare two versions of an element, like an ad or an email, to determine which one performs better. In an A/B test, one audience segment is shown version A, while another is shown version B. The results are then analyzed to determine which version generates better results based on key metrics, such as click-through or conversion rates.
How do we achieve personalization of our commercial offers with AI?
We collect data from various sources and carefully process it using feature engineering. This technique helps us convert the data into useful features, such as the average and maximum amount spent by the customer in the supermarket in the last month. This enables our artificial intelligence models to better comprehend our customers’ financial situation, their activity in our mobile app, and their interests. Over time, they can even discover new characteristics and patterns based on data analysis.
For these models to function across different countries, we utilize standardized global data sources. This means that all data used have the same format in all the bank’s operating regions.This standardized information, along with records of products that customers have previously obtained from BBVA, is utilized by an AI model to learn and identify customer characteristics indicating interest or need for specific products.
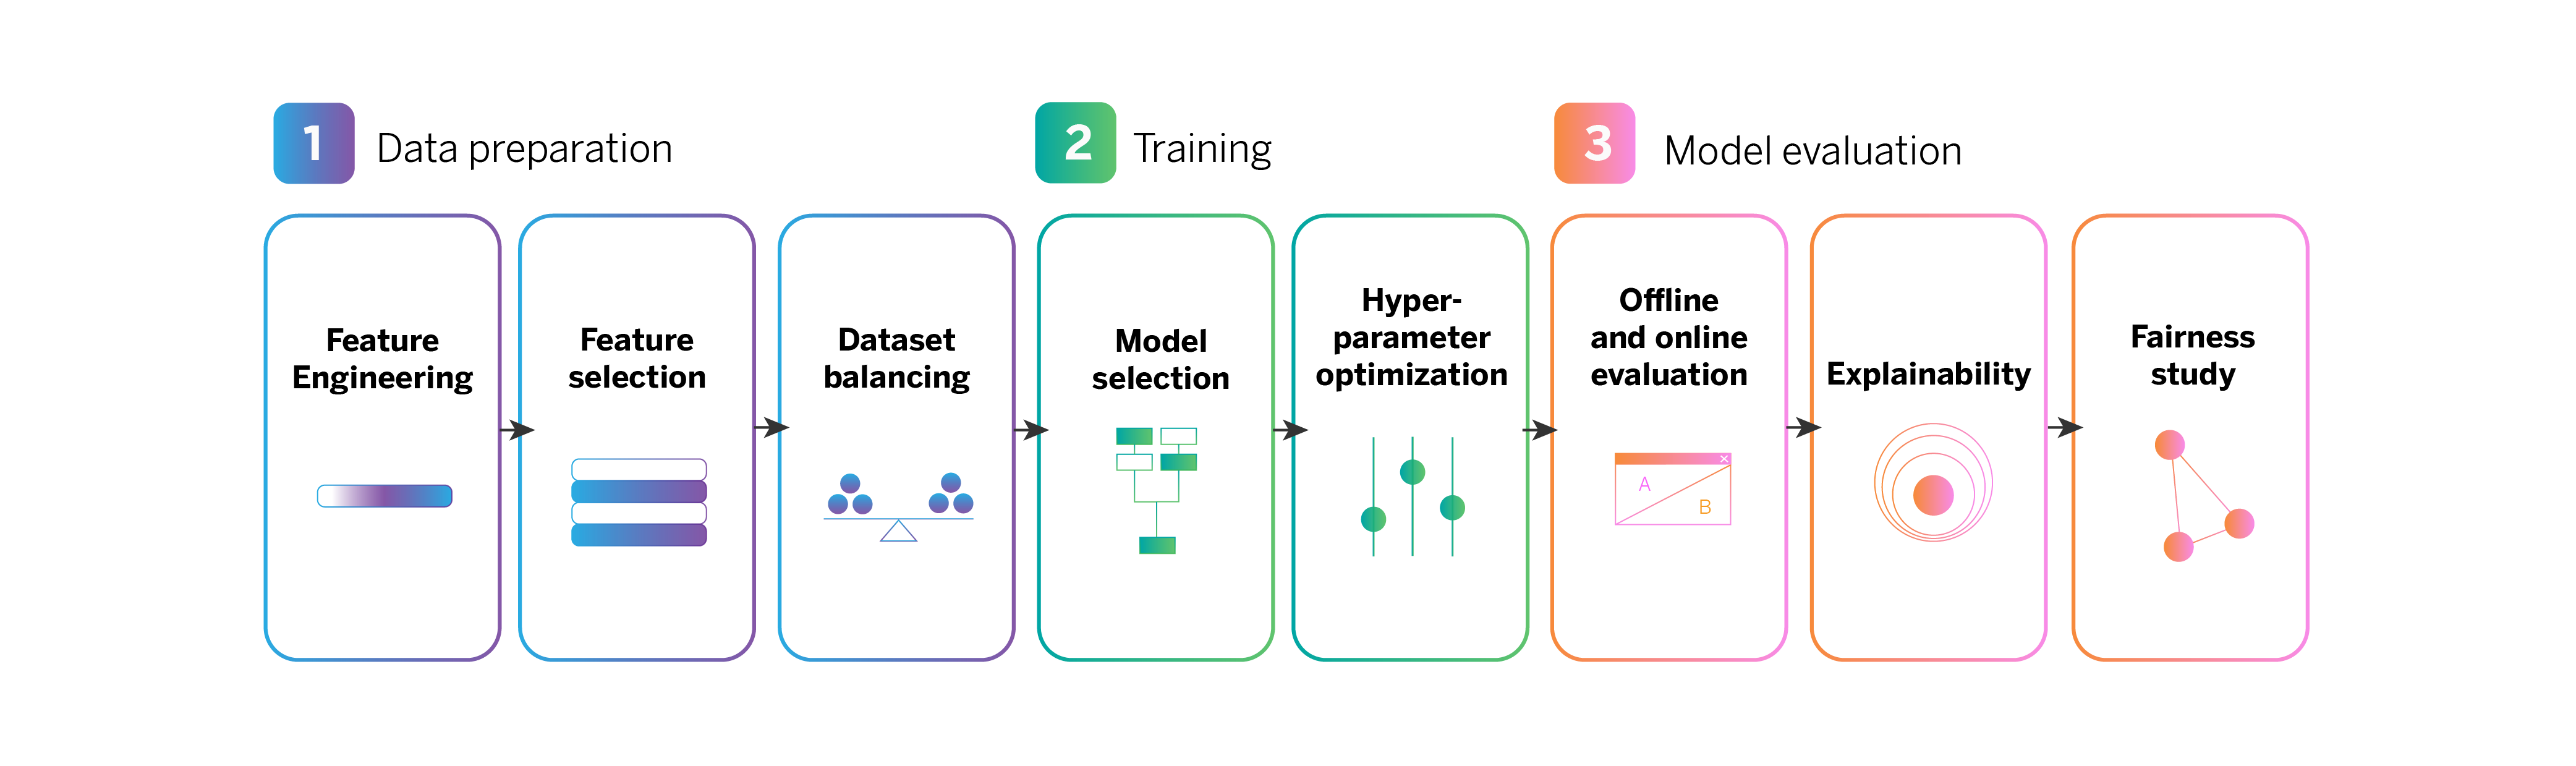
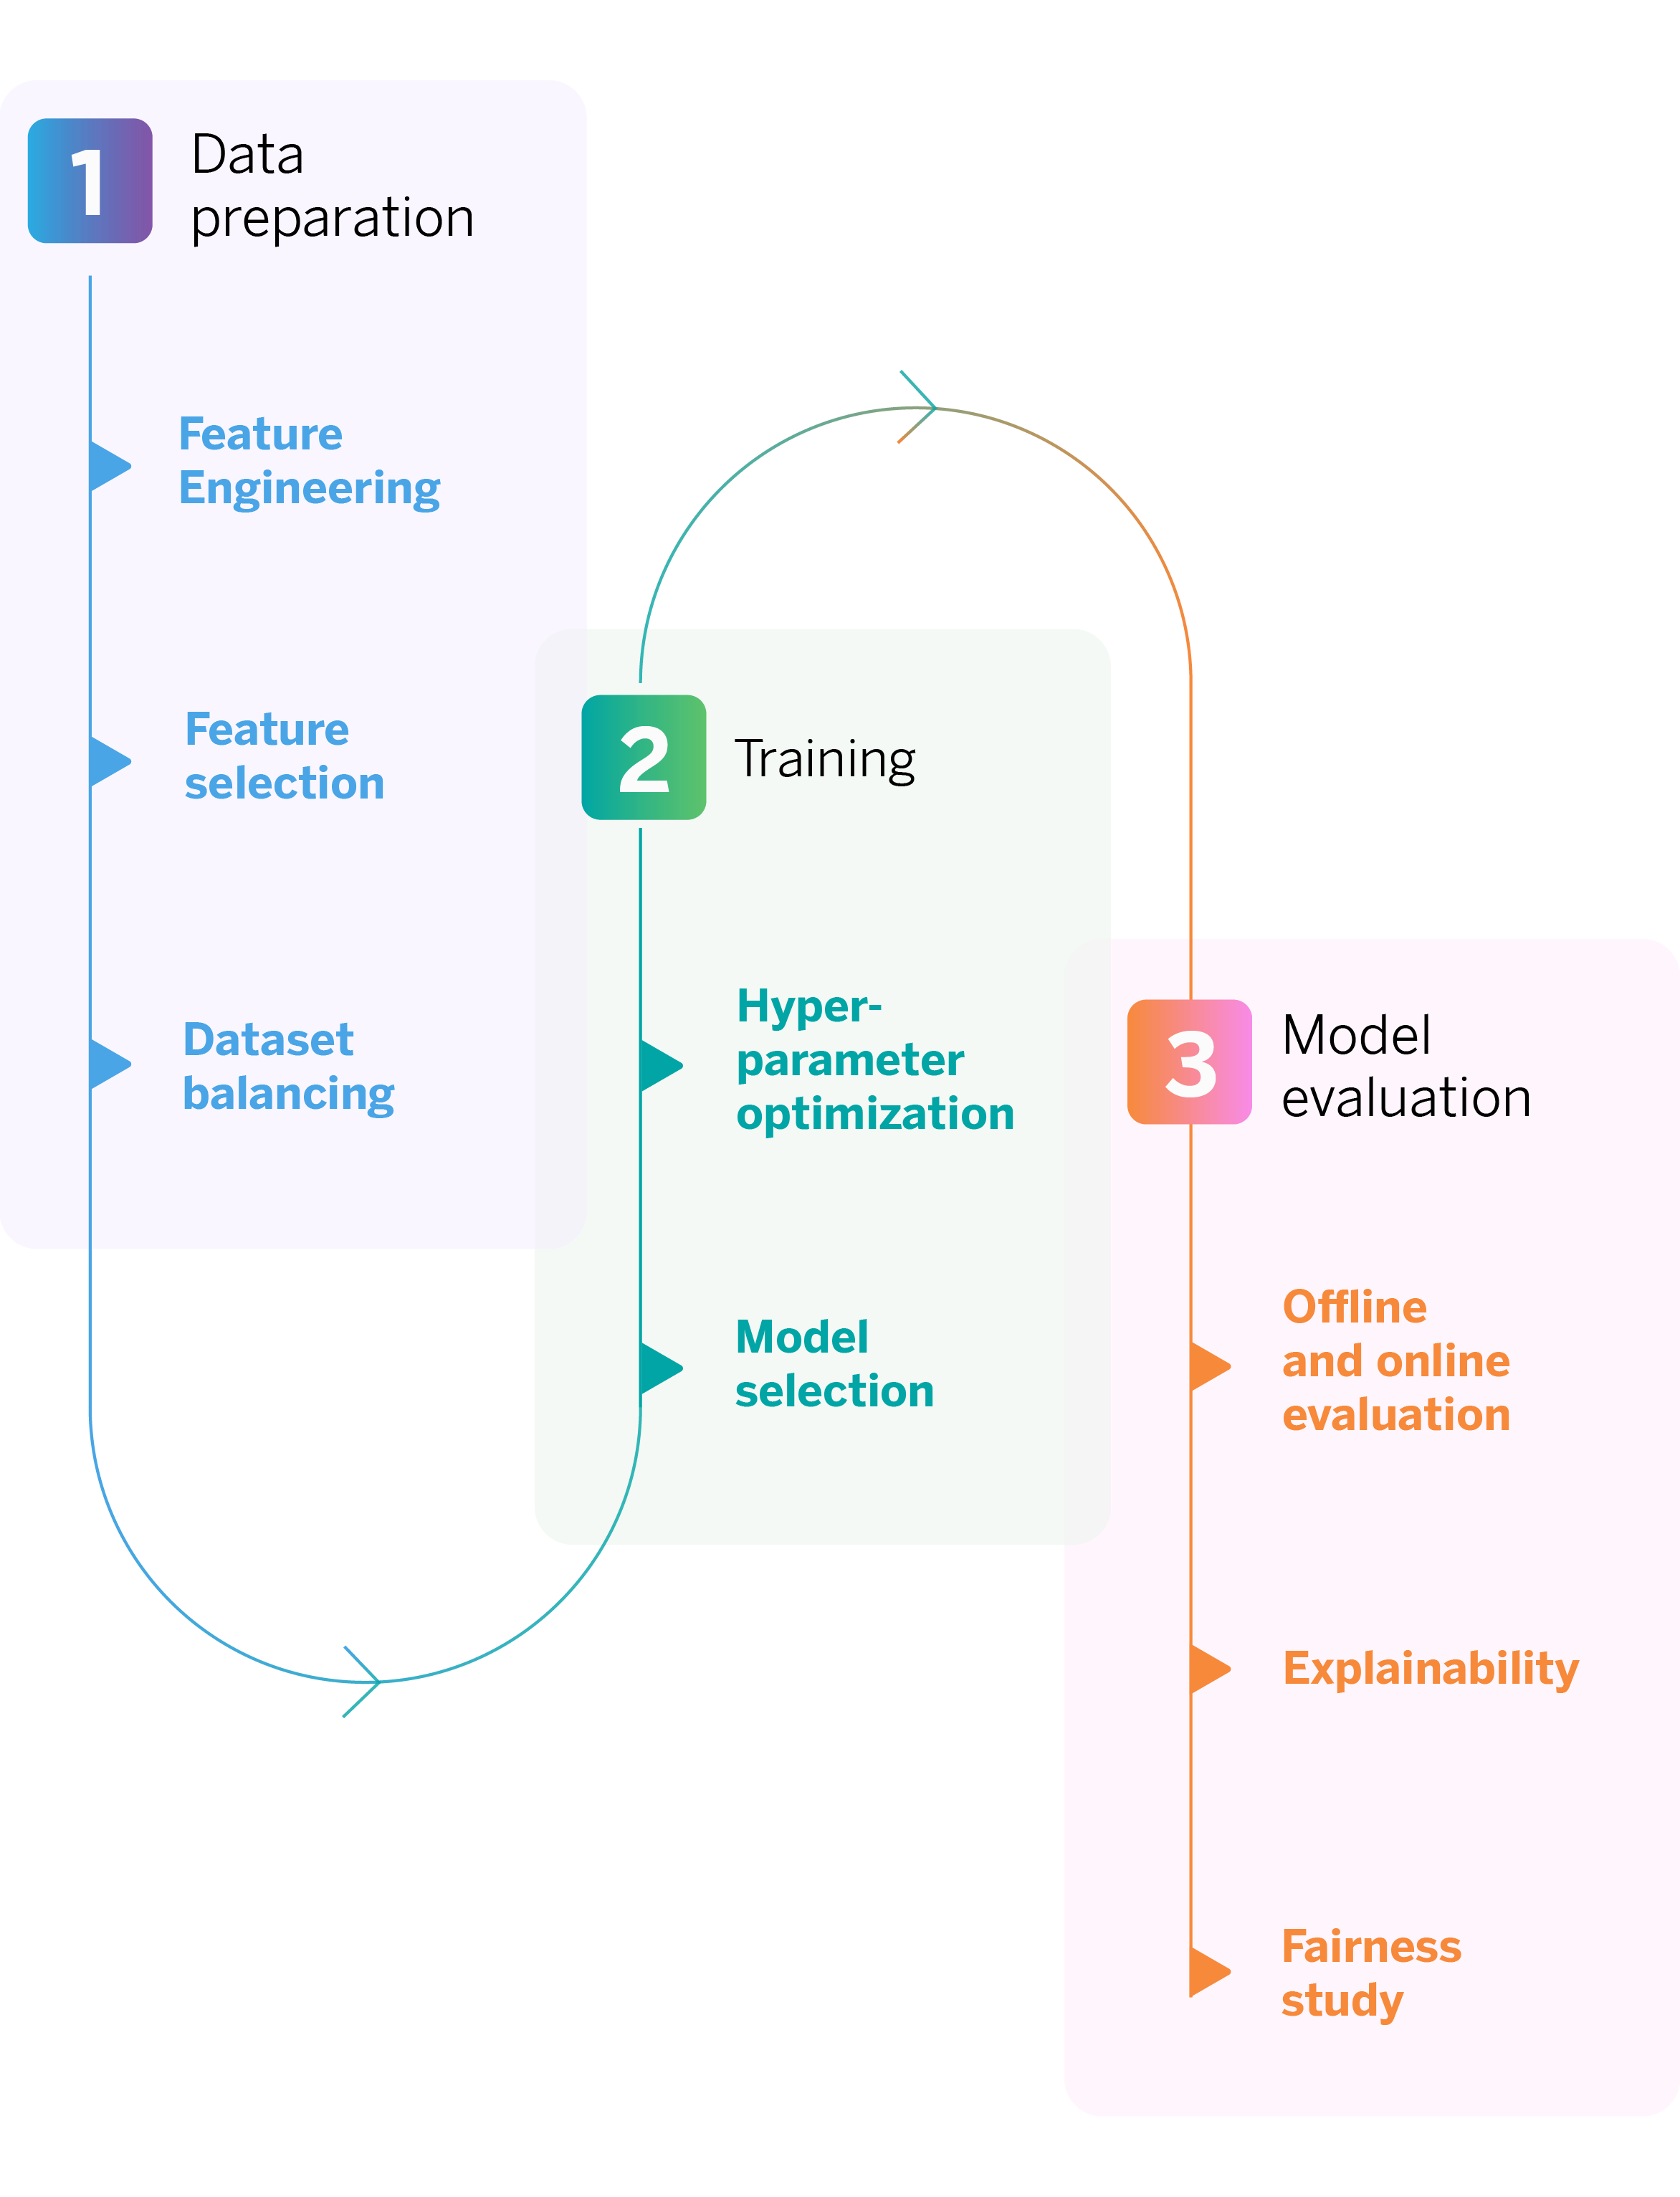
We have followed a series of steps to reach this point, which together define our digital sales pipeline.
Our digital sales machine learning pipeline, step-by-step
Data preparation
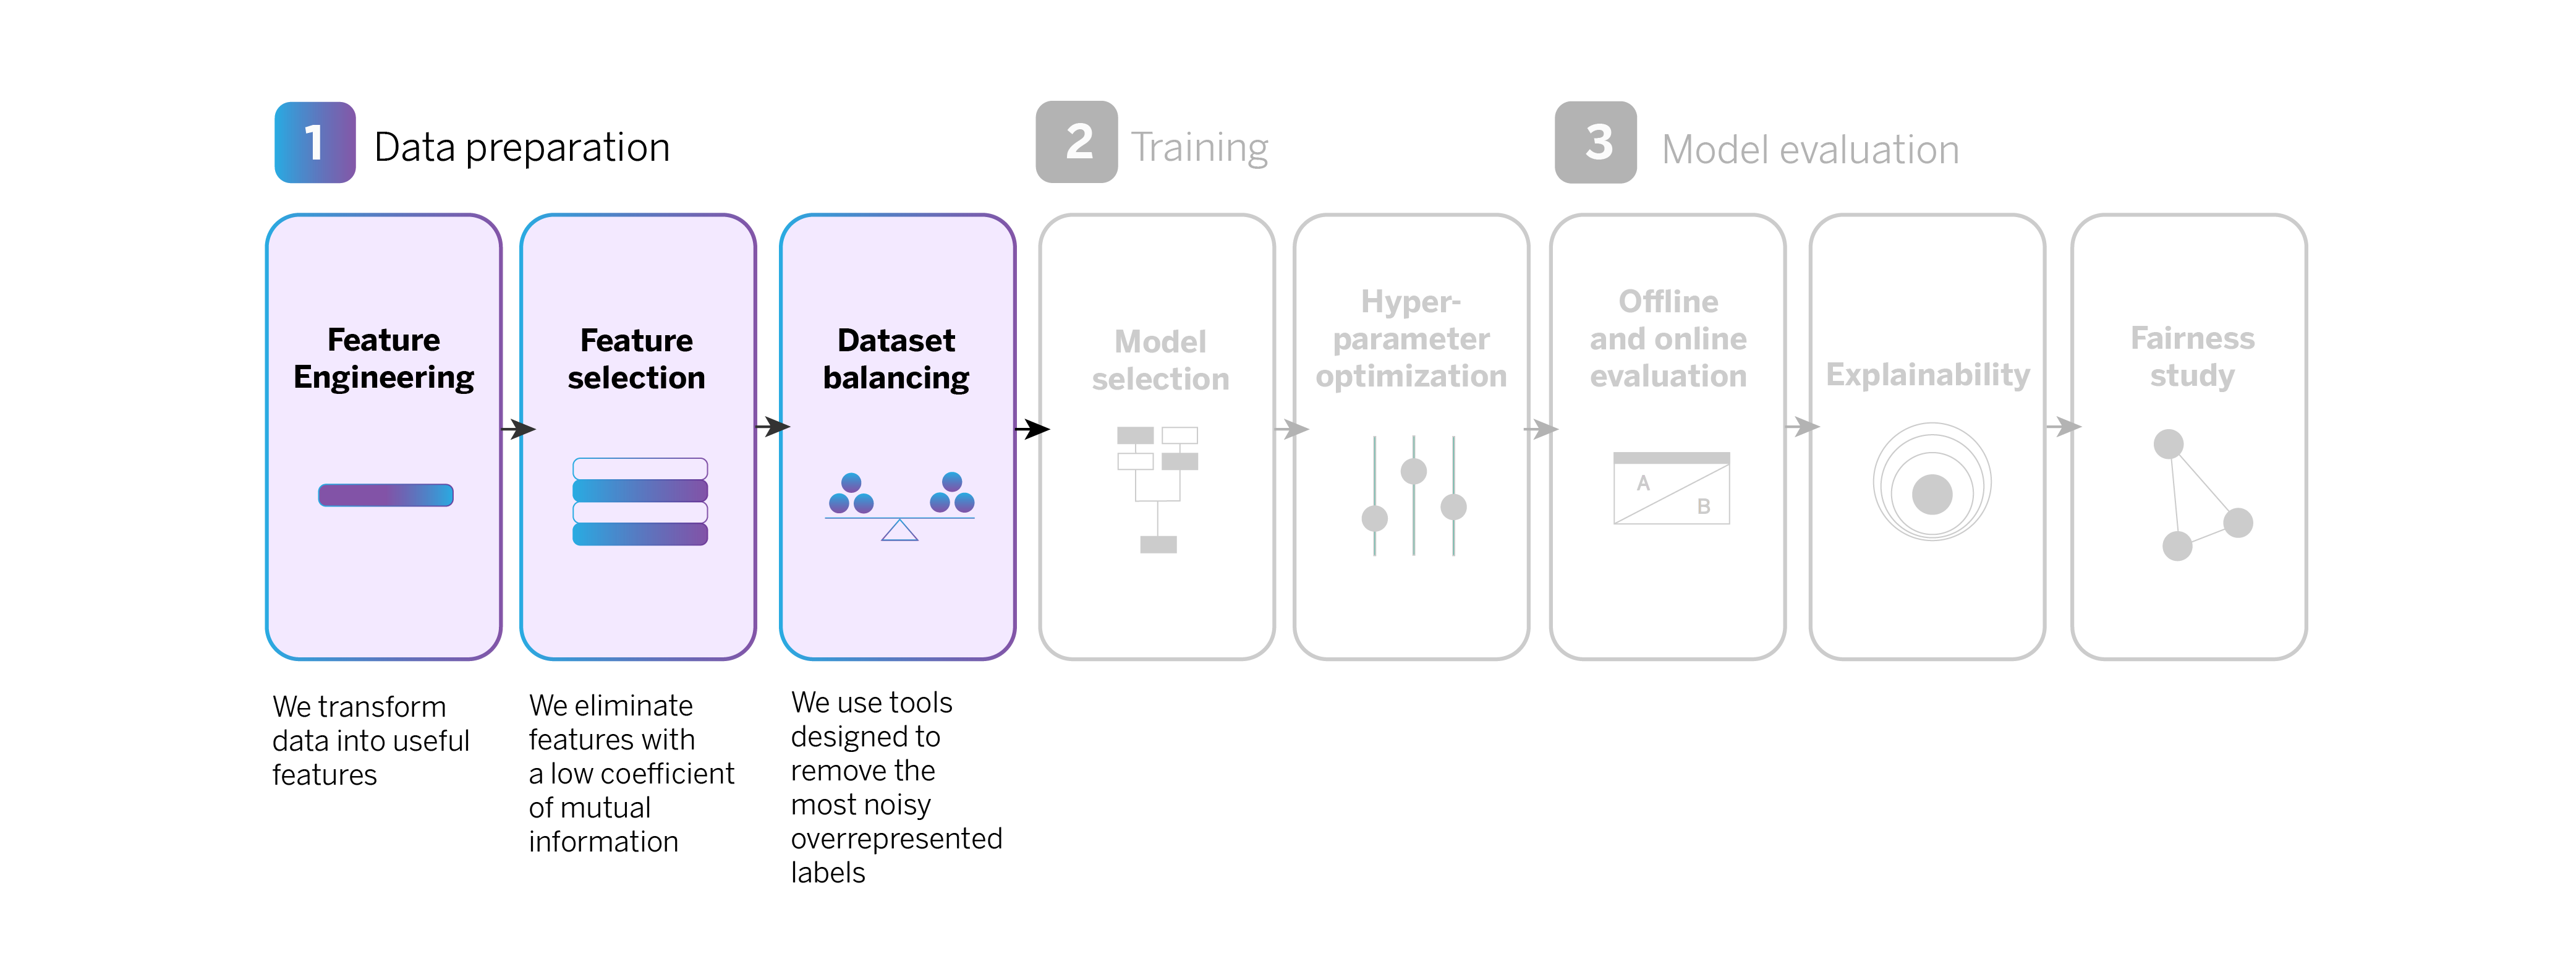
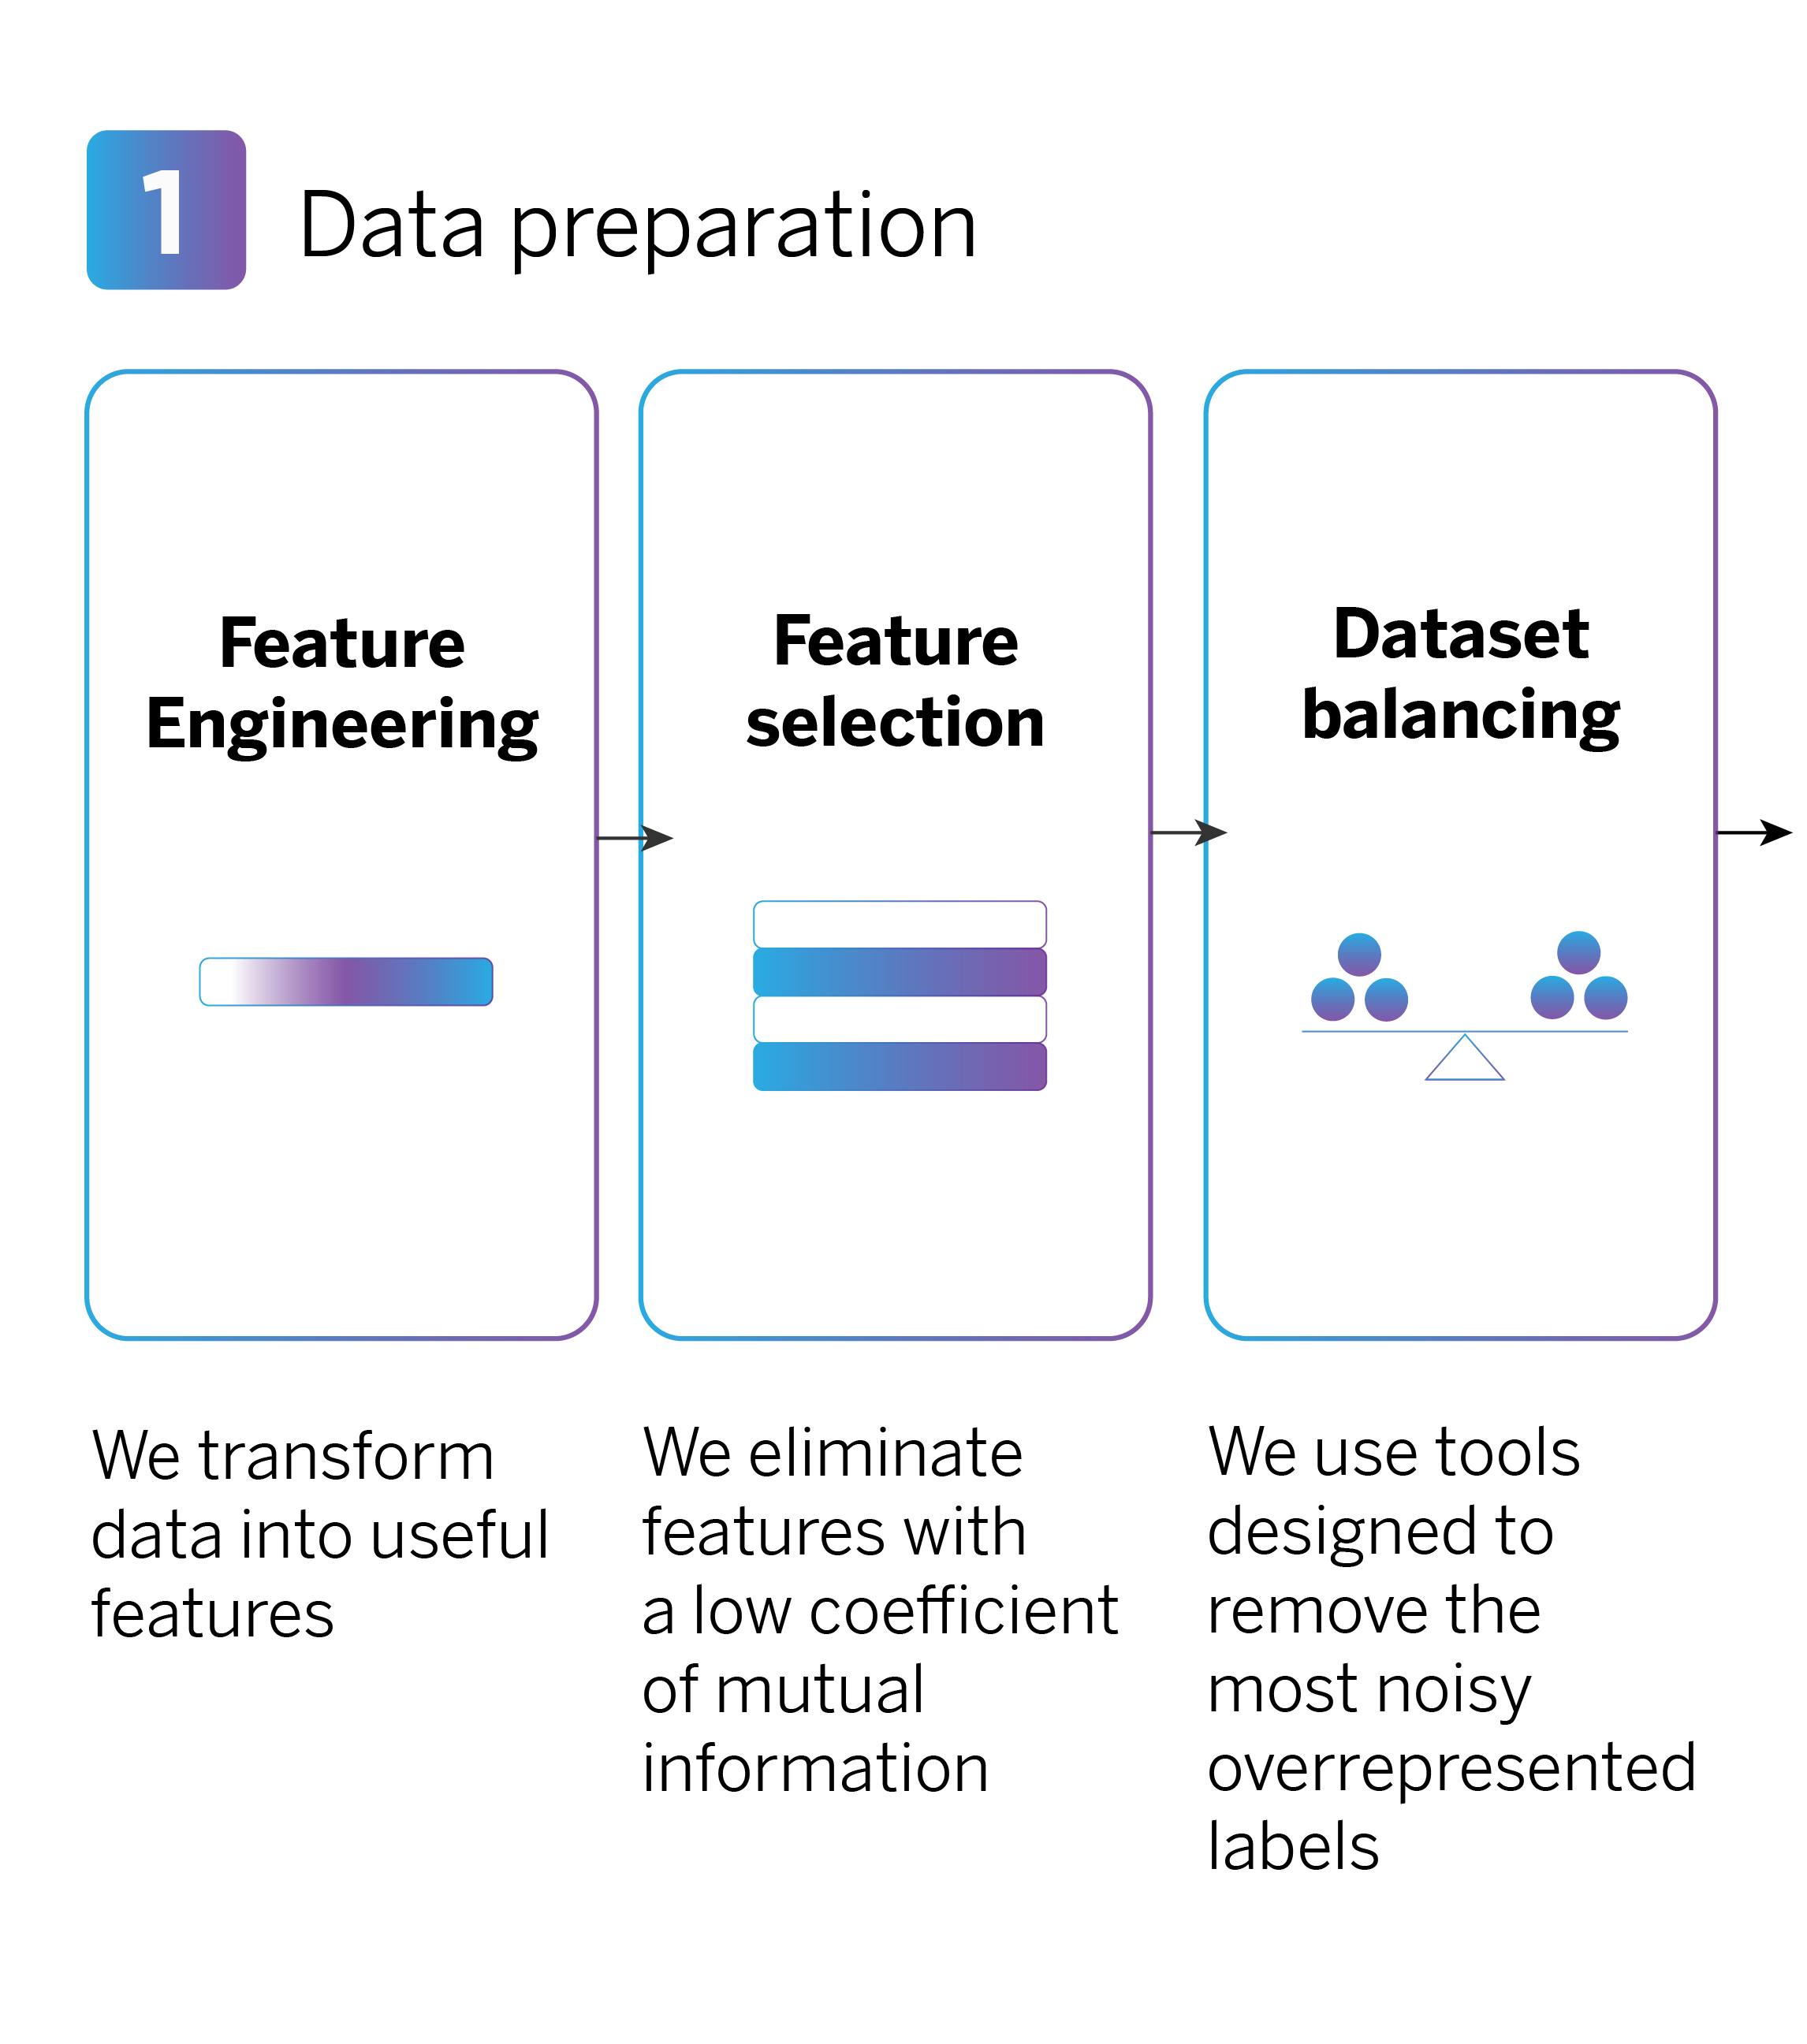
When performing feature engineering, numerous features are generated, some of which may not be useful or relevant for training the AI model. By reducing the number of features, we can control computational costs and increase the efficiency of model training.
In a second step, we choose features based on their “mutual information,” representing the relationship between each feature (for example, the total expenditure on bars and restaurants) and the target variable (e.g., opening a “Metas” saving account). We then eliminate features with a low coefficient of mutual information, as they are less relevant for training the model.
Finally, in this first phase of data preparation, it is important to balance the dataset so that the model makes more accurate and balanced predictions for all types of products.
Our recommendation system offers a range of commercial products, including credit cards and savings accounts. Sales volume varies significantly for each product, which is evident in the historical data used to train the model. This variation can create an “unbalanced dataset,” causing the model to favor and predict the more prevalent product types. For instance, if there are far more debit card sign-ups than savings accounts, the model may prioritize predicting debit card sign-ups and overlook savings accounts.
In order to address this issue, we utilize a library known as CleanLab which assists us in identifying and eliminating noisy observations from the most represented classes, thereby achieving a more balanced dataset.
Model training
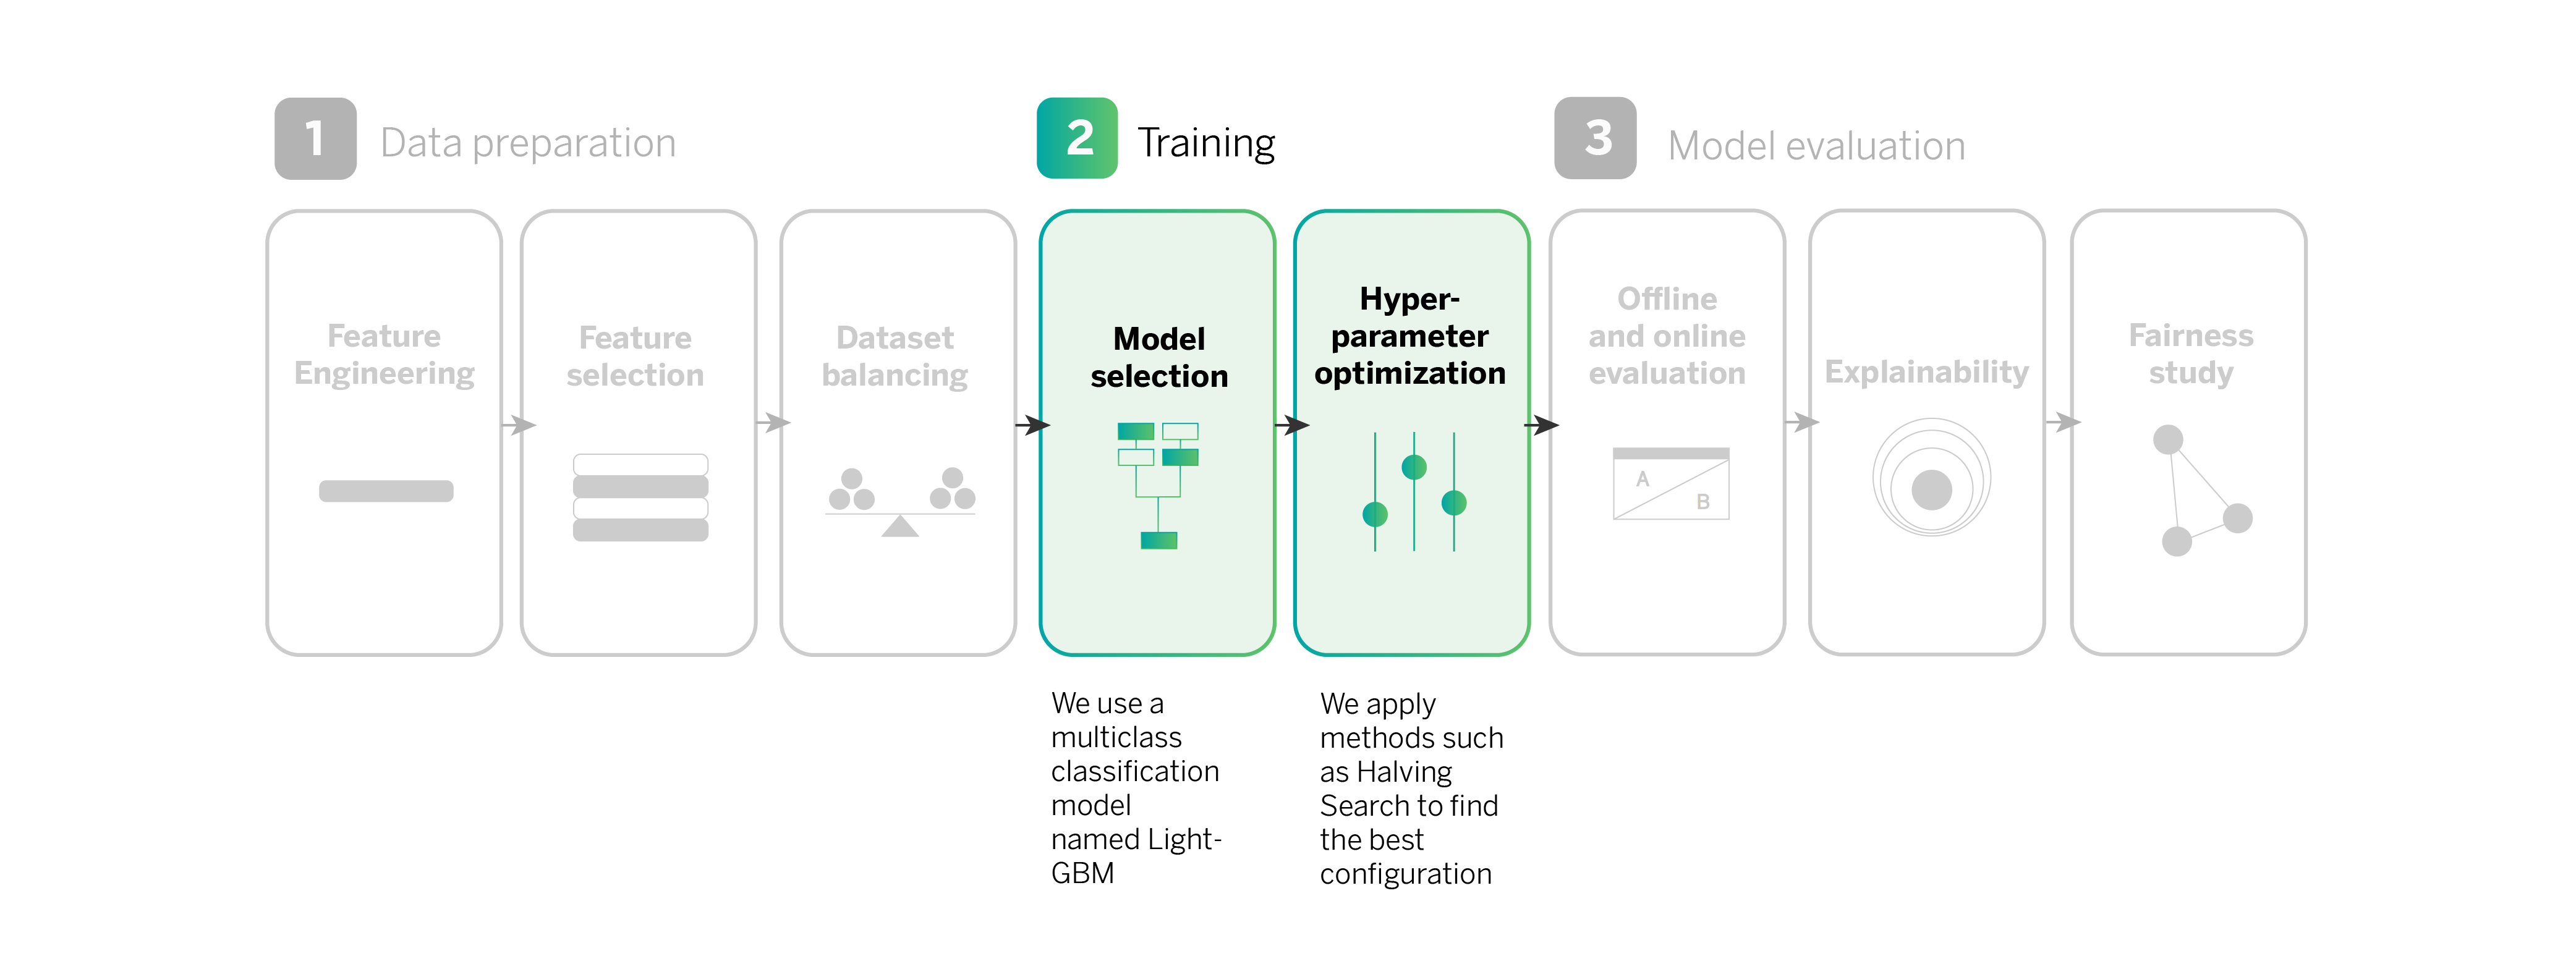
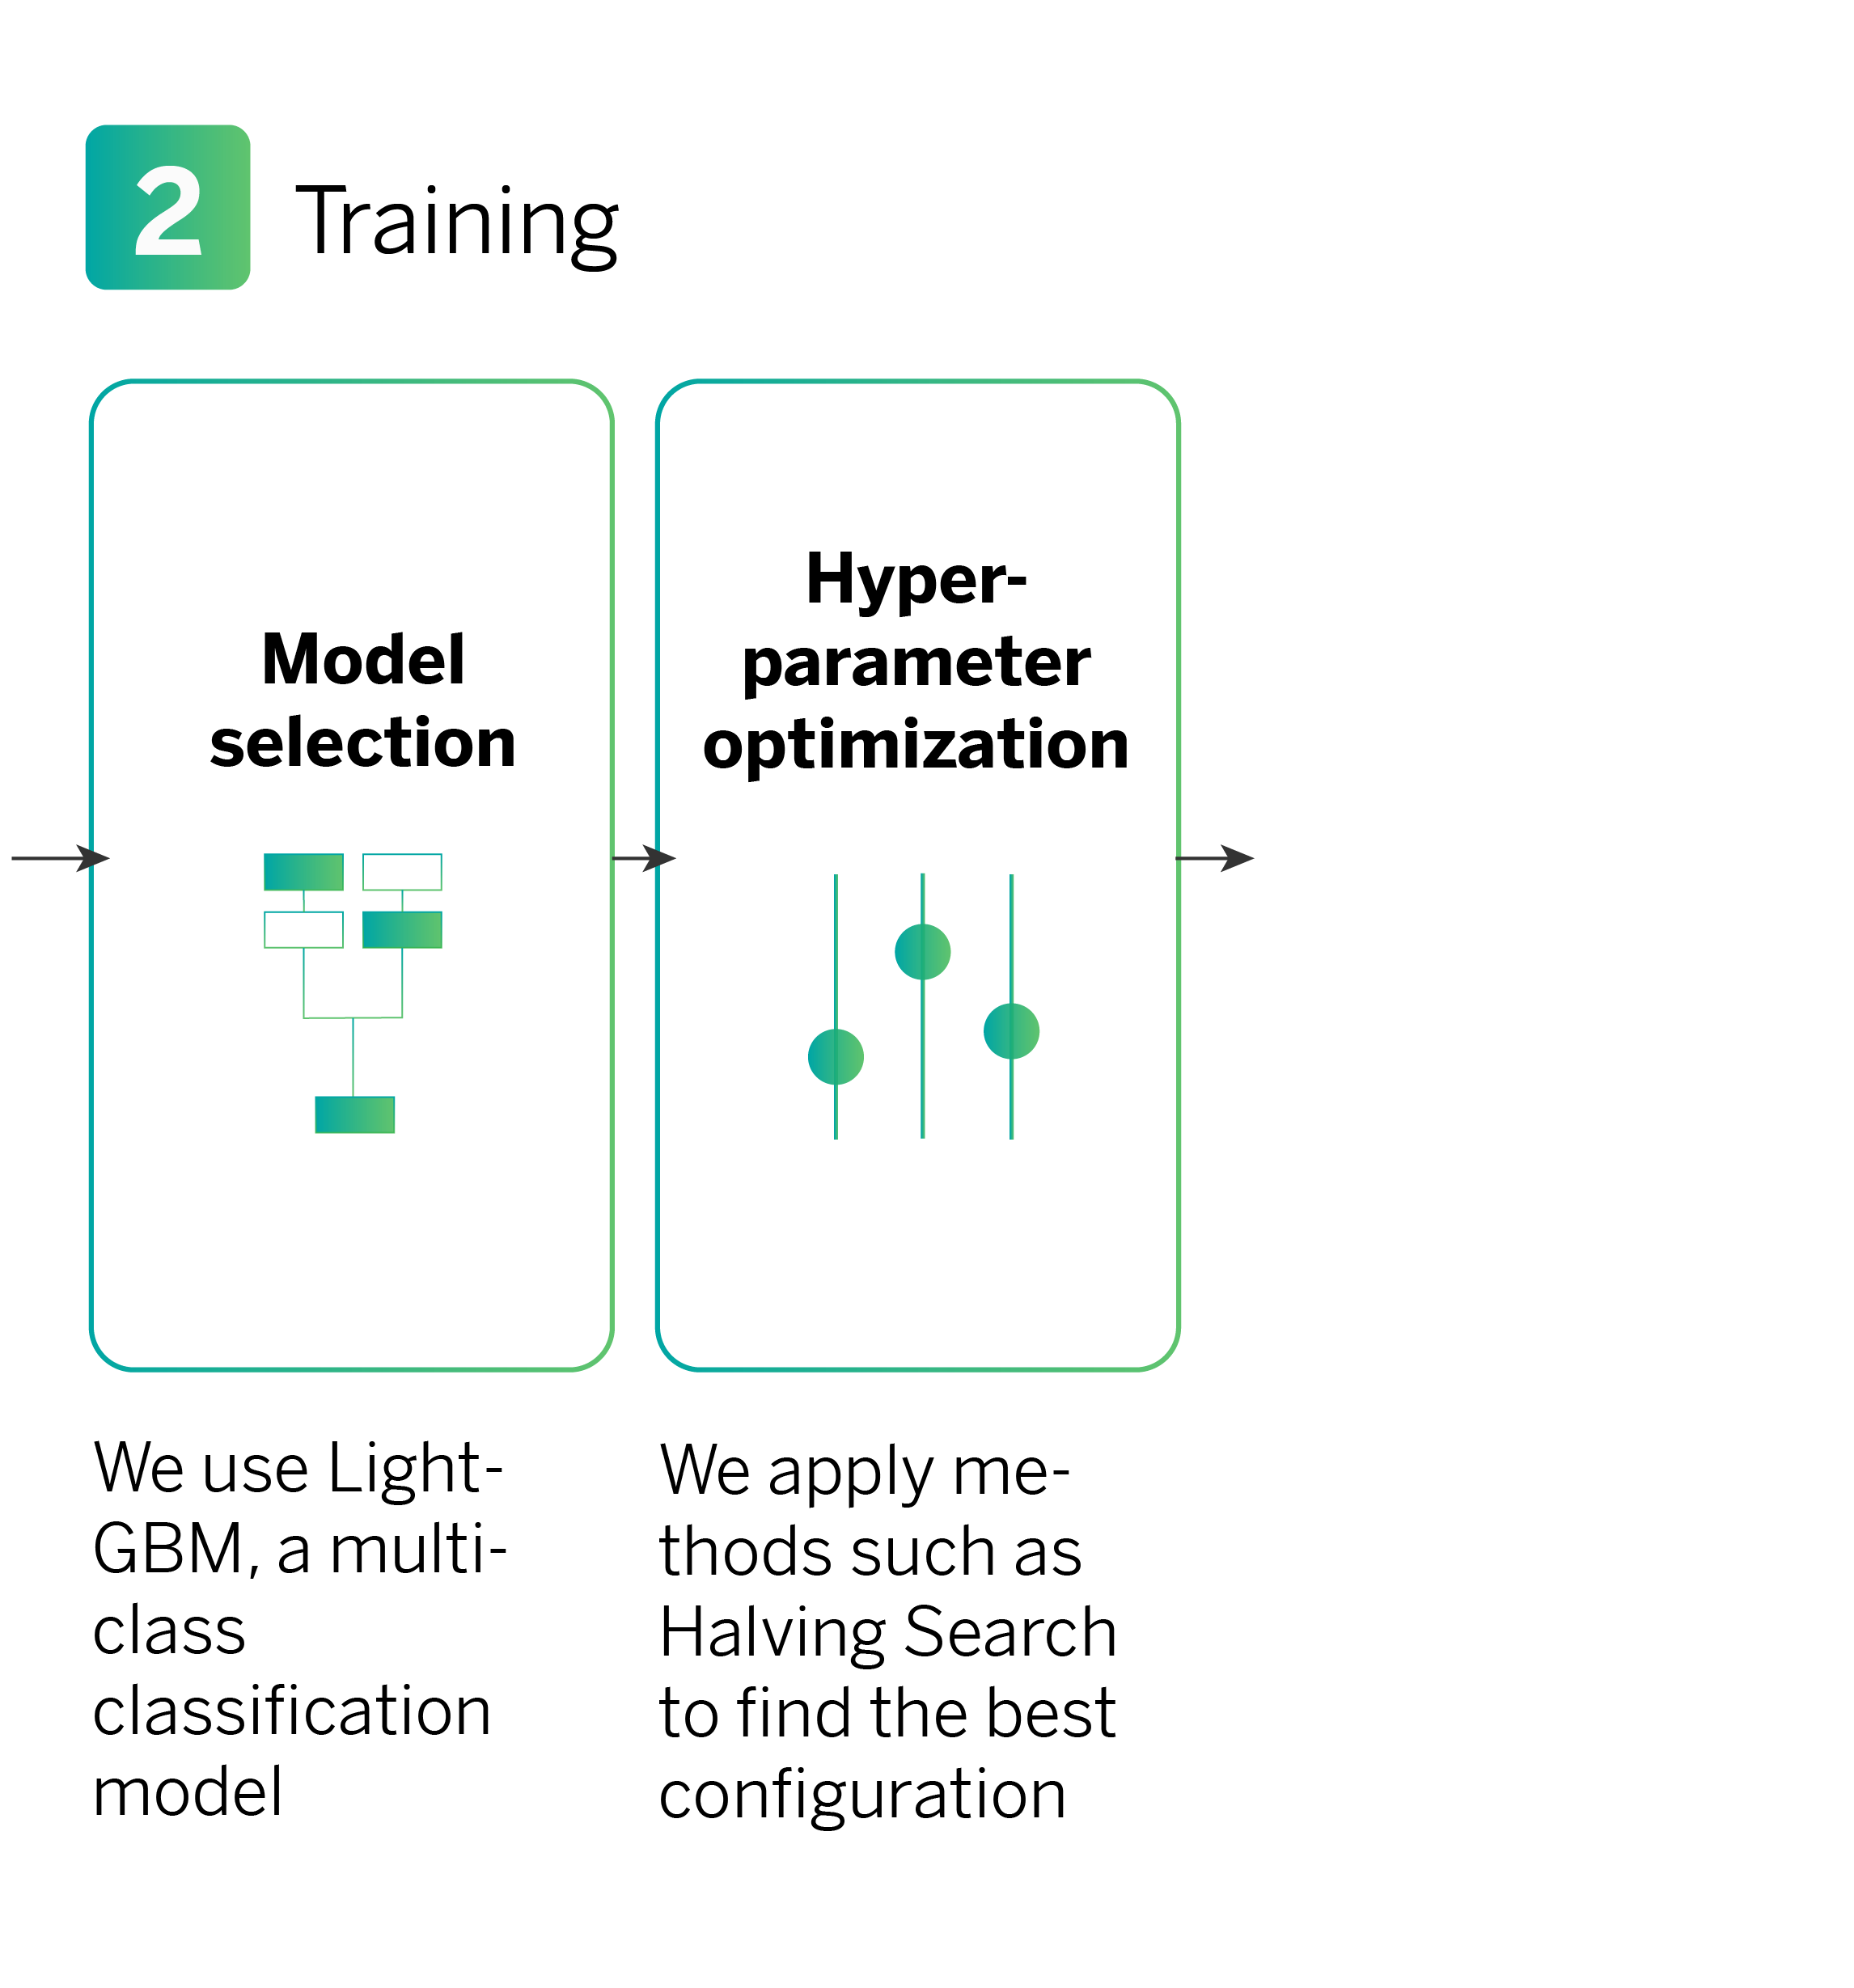
After preparing the data, the next step is to train a multiclass classification model to predict the types of products that a customer might need. In this instance, we utilize an algorithm based on decision trees’ models called LightGBM, which is highly efficient for this task.
In the training process, we use the Halving Search method to optimize the hyperparameters. Hyperparameters are internal settings of the model that can be adjusted to enhance its performance (training speed) and behavior (model accuracy). Examples of hyperparameters include the learning rate and the number of iterations.
The Halving Search method involves testing various configurations with limited resources (i.e., the number of samples used to train the model). Underperforming configurations are discarded in each iteration, while more samples are allocated to configurations that demonstrate better performance. This iterative process continues until we arrive at the best configuration for our model.
Model evaluation
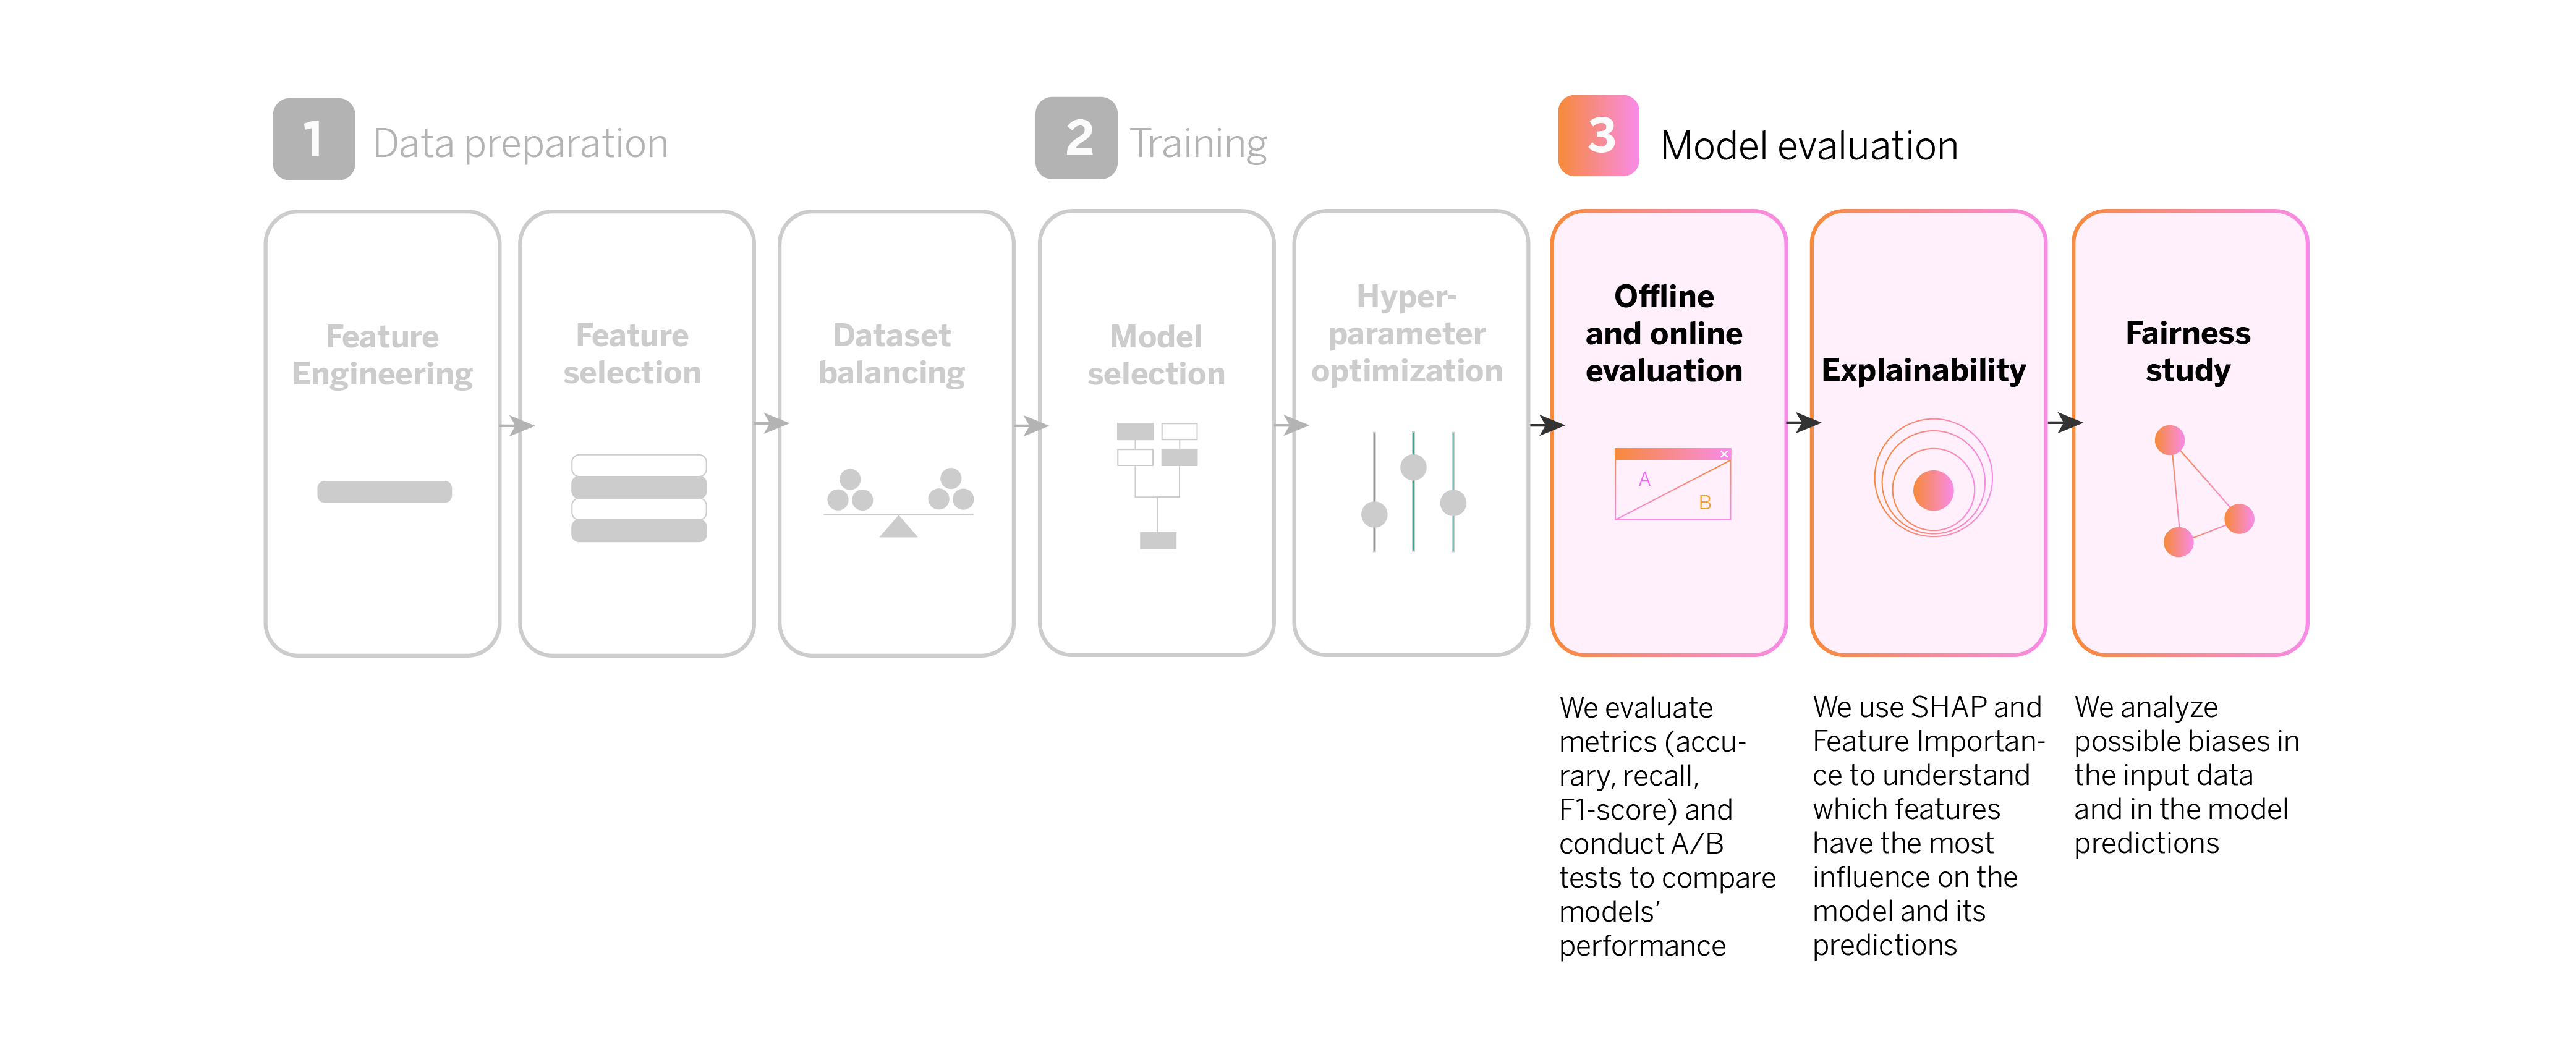
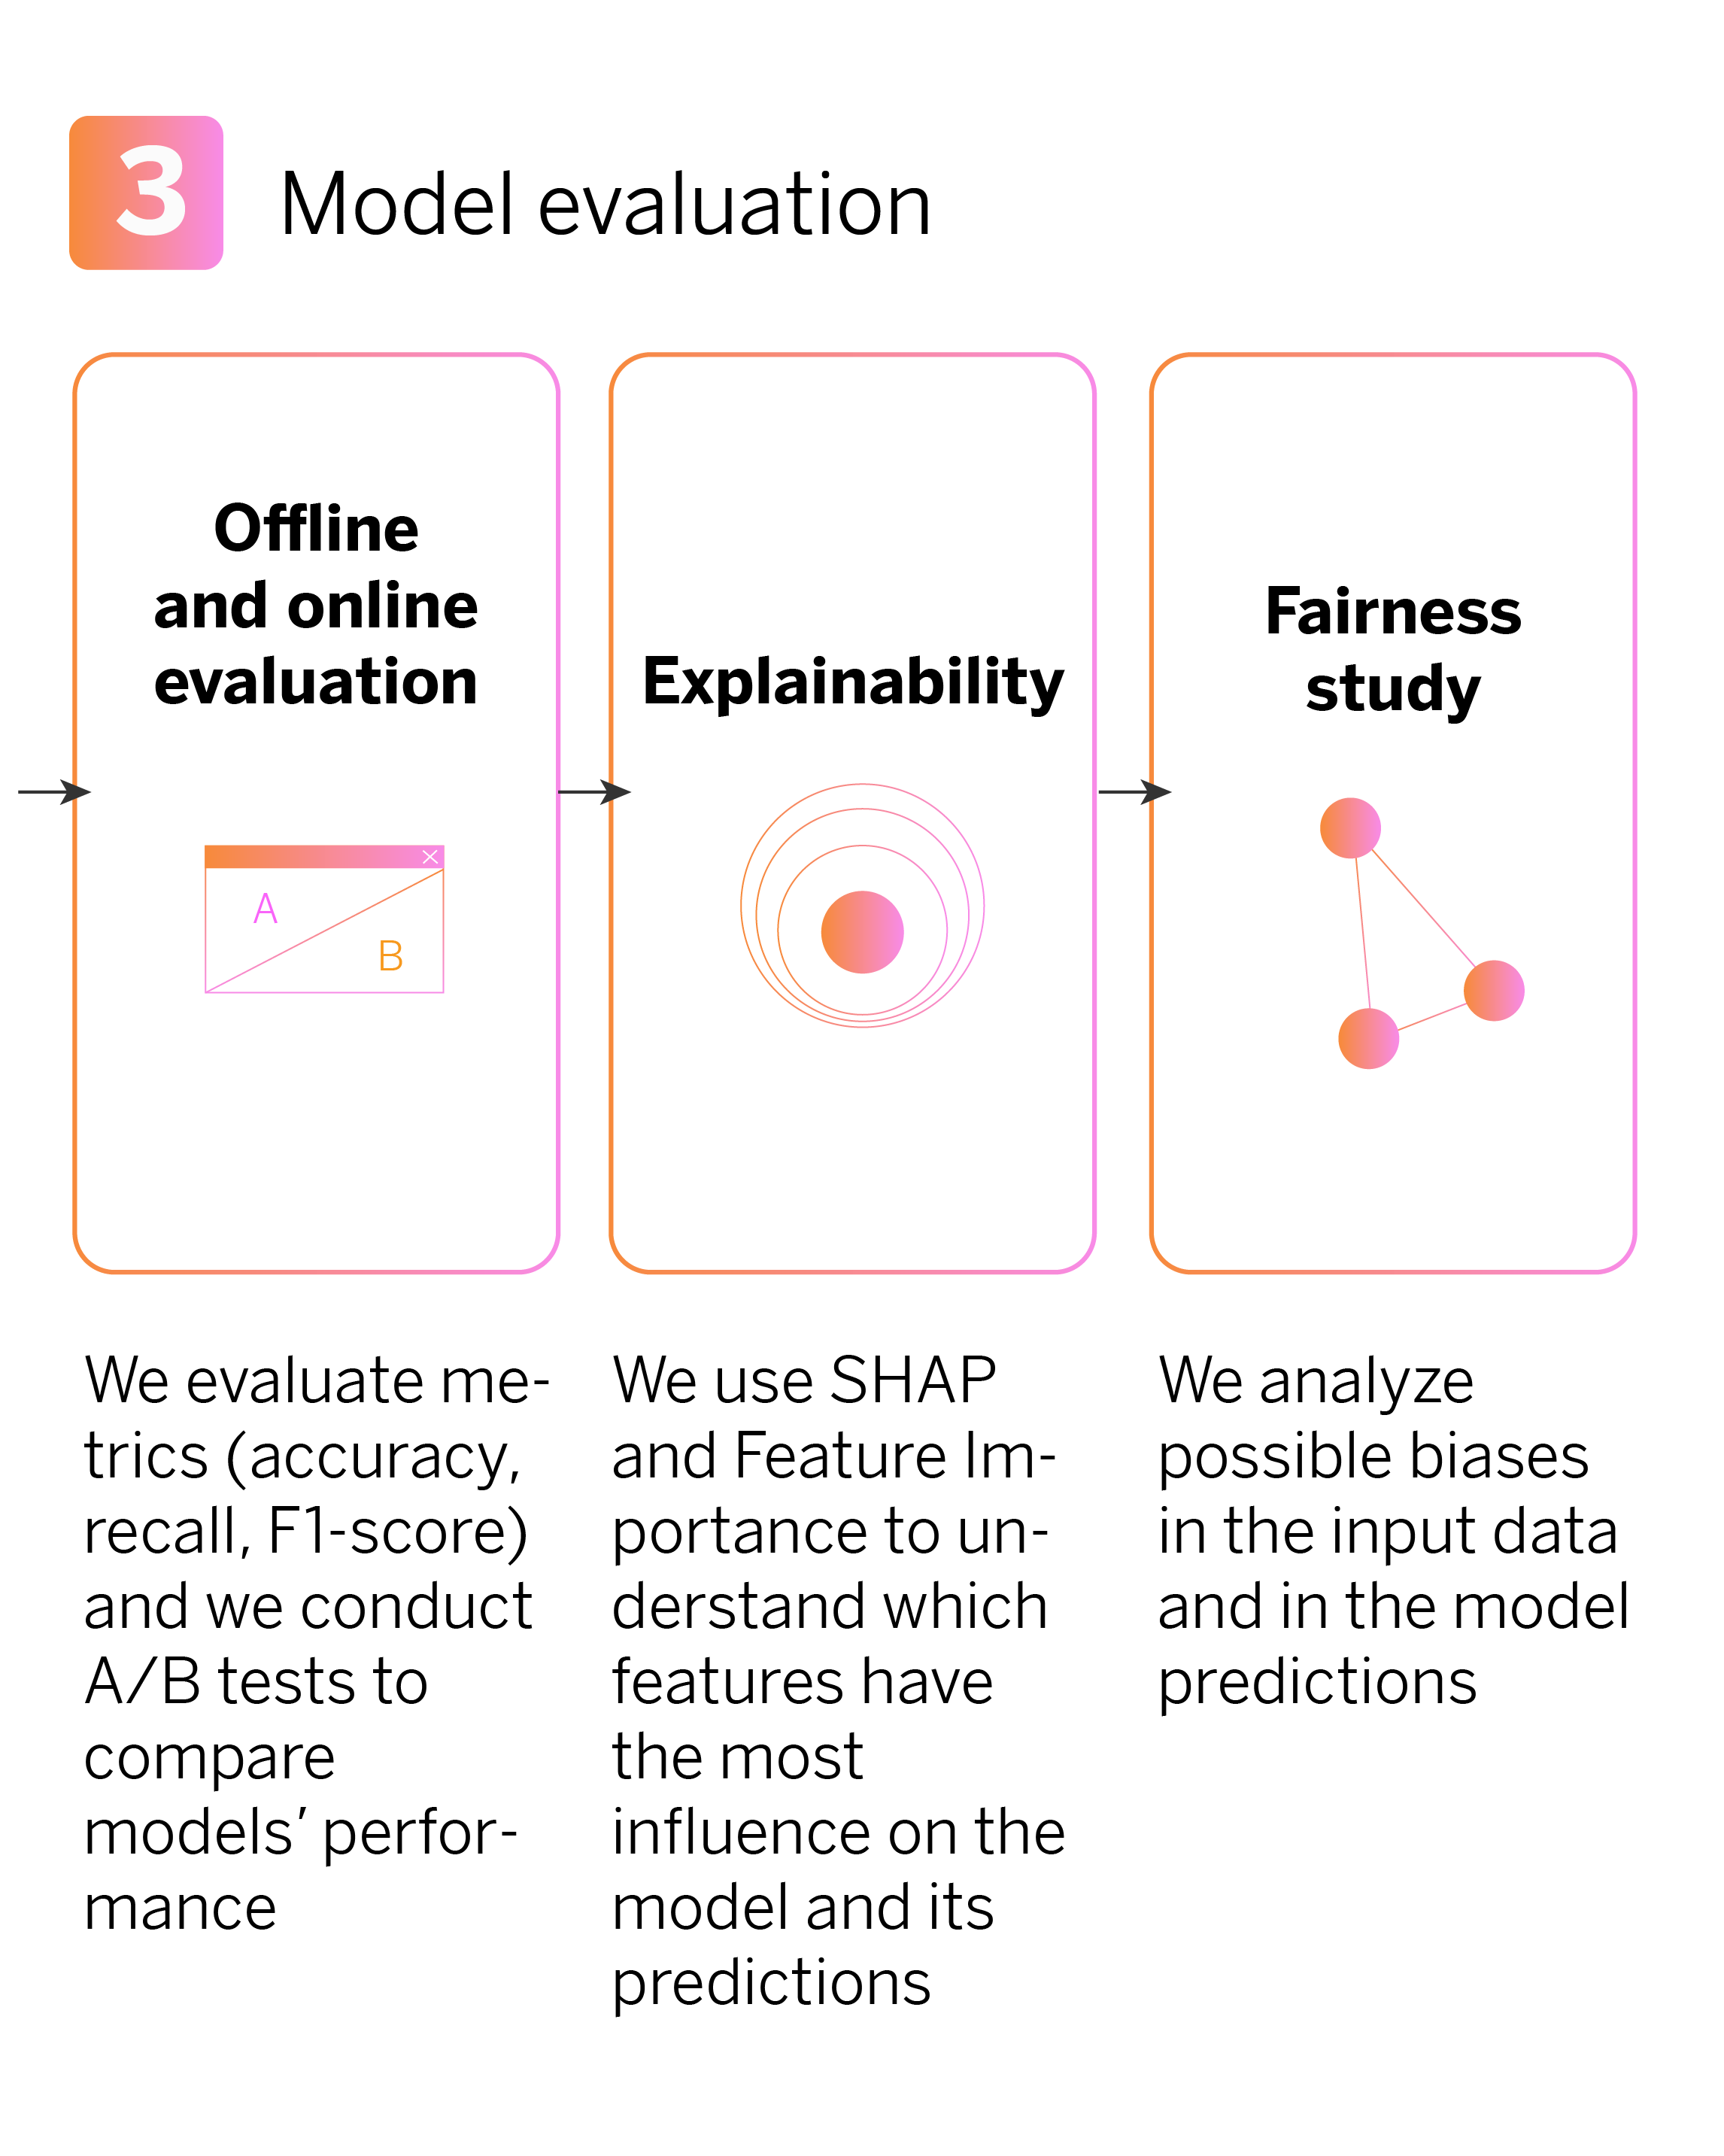
We use several metrics to evaluate model performance, both online and offline. We measure accuracy, which tells us how many of the model’s predictions are correct. Recall measures how many true cases the model identifies. To get a balanced view of model performance, we use F1-Score, which combines accuracy and recall. These metrics are also calculated in their weighted versions, meaning we consider the relative importance of different product classes.
In addition, we utilize confusion matrices. These matrices provide a detailed breakdown of how the model categorizes products, enabling us to pinpoint the product categories in which the model has greater errors and even which ones it confuses with each other.
We also use ranking metrics to understand the model’s effectiveness in product recommendations. These metrics help assess the model’s performance and identify areas for adjustment.
On the other hand, we perform A/B testing (online evaluation) to compare different versions of the model in production, where A would be one model and B a different one. By examining the conversion metrics of each model version, we can determine whether the results after updating it are statistically significant. This allows us to validate a new version of the model as long as it demonstrates a significant improvement compared to the previous version.
Model evaluation: Explainability
One of the primary goals of the evaluation phase is for all teams involved in the development, including technical and business teams, to comprehend which data variables influence the recommendation of specific products and how they do so, both individually and globally. To achieve this, we employ explainability techniques:
- Feature Importance. This tool helps us identify the most important variables for the model. In essence, it reveals which data carries more weight when the model is learning to make predictions. For instance, if we’re recommending a corporate credit card, the feature importance can indicate that the payroll balance or social security expenses are highly influential variables.
- Shapley values. The SHAP values are useful for understanding how each variable impacts a model’s predictions for each product. They provide detailed explanations of how each characteristic influences the model’s decision. For instance, they can demonstrate how a customer’s monthly income affects the likelihood of receiving a credit card recommendation.
Model evaluation: Fairness study
After finishing our machine learning pipeline, a crucial question arises: Is the model replicating, amplifying, or reducing biases? To address this, we examine the existing biases in the input data and the model’s predictions in relation to the protected variables.
Protected variables are traits or attributes of individuals shielded by laws or regulations from discrimination. It is crucial to ensure that the model does not show bias toward any particular population group or exhibit more errors with one group than with another.
We utilize three fairness metrics for this purpose:
- Predictive Parity (PPV). This metric measures the proportion of people who have hired what they were offered, i.e., when the model is correct.
- Predictive Equality (FPR). This metric measures the proportion of people who have not hired what they were offered, i.e., when the model fails.
- Equal Opportunity Rate (FNR). This metric measures the proportion of people who were not offered a product they would have purchased, i.e., when the model fails to correctly identify an opportunity.
These metrics ensure the model works fairly and equitably for all customers without favoring or disadvantaging any specific group.
Conclusions: the perks of personalizing commercial offers with AI
Our aim in tailoring commercial offers with AI is to provide more accurate answers to the questions of what product we are offering, to whom, how, and when. This enables us to introduce targeted commercial offers that cater to the specific needs of our customers.
Continuous evaluation and experimentation ensure that our commercial offerings remain relevant and effective over time, while a commitment to transparency and fairness guarantees a balanced experience for all customers.
Notes
- Percentage of units sold through digital channels ↩︎