
How to unveil financial habits through recurring pattern analysis
At BBVA, we prioritize our customers’ financial well-being. Thus, the first step to understanding and providing effective financial health tools is analyzing their financial habits.
We view habits as consistent behavior patterns developed over time. This understanding enables us to recognize how individuals manage their finances and, based on this, provide them with tools to better manage their resources.
However, this analysis poses a challenge: people do not act predictably. Their financial decisions can be influenced by unforeseen events and changes in personal circumstances, which introduces high variability in their transactions.
To address this complexity, BBVA combines advanced algorithms with statistical techniques, developing systems to better understand our customers’ financial habits. This allows us to design more efficient solutions tailored to their needs and better support them in managing their financial health.
The context of analyzing financial habits
Recurring financial habits, such as bill payments and consistent transfers or contributions to investment funds, are crucial indicators of a client’s financial health. However, irregular data points, such as exceptional transactions that do not represent typical behavior, can distort these patterns.
For example, let’s consider a customer who does their weekly grocery shopping. They prefer to stock up once a week instead of daily, which is a clear habit. However, during a given week, they might make an additional purchase to replenish a product they forgot or, conversely, skip their regular visit due to a trip.
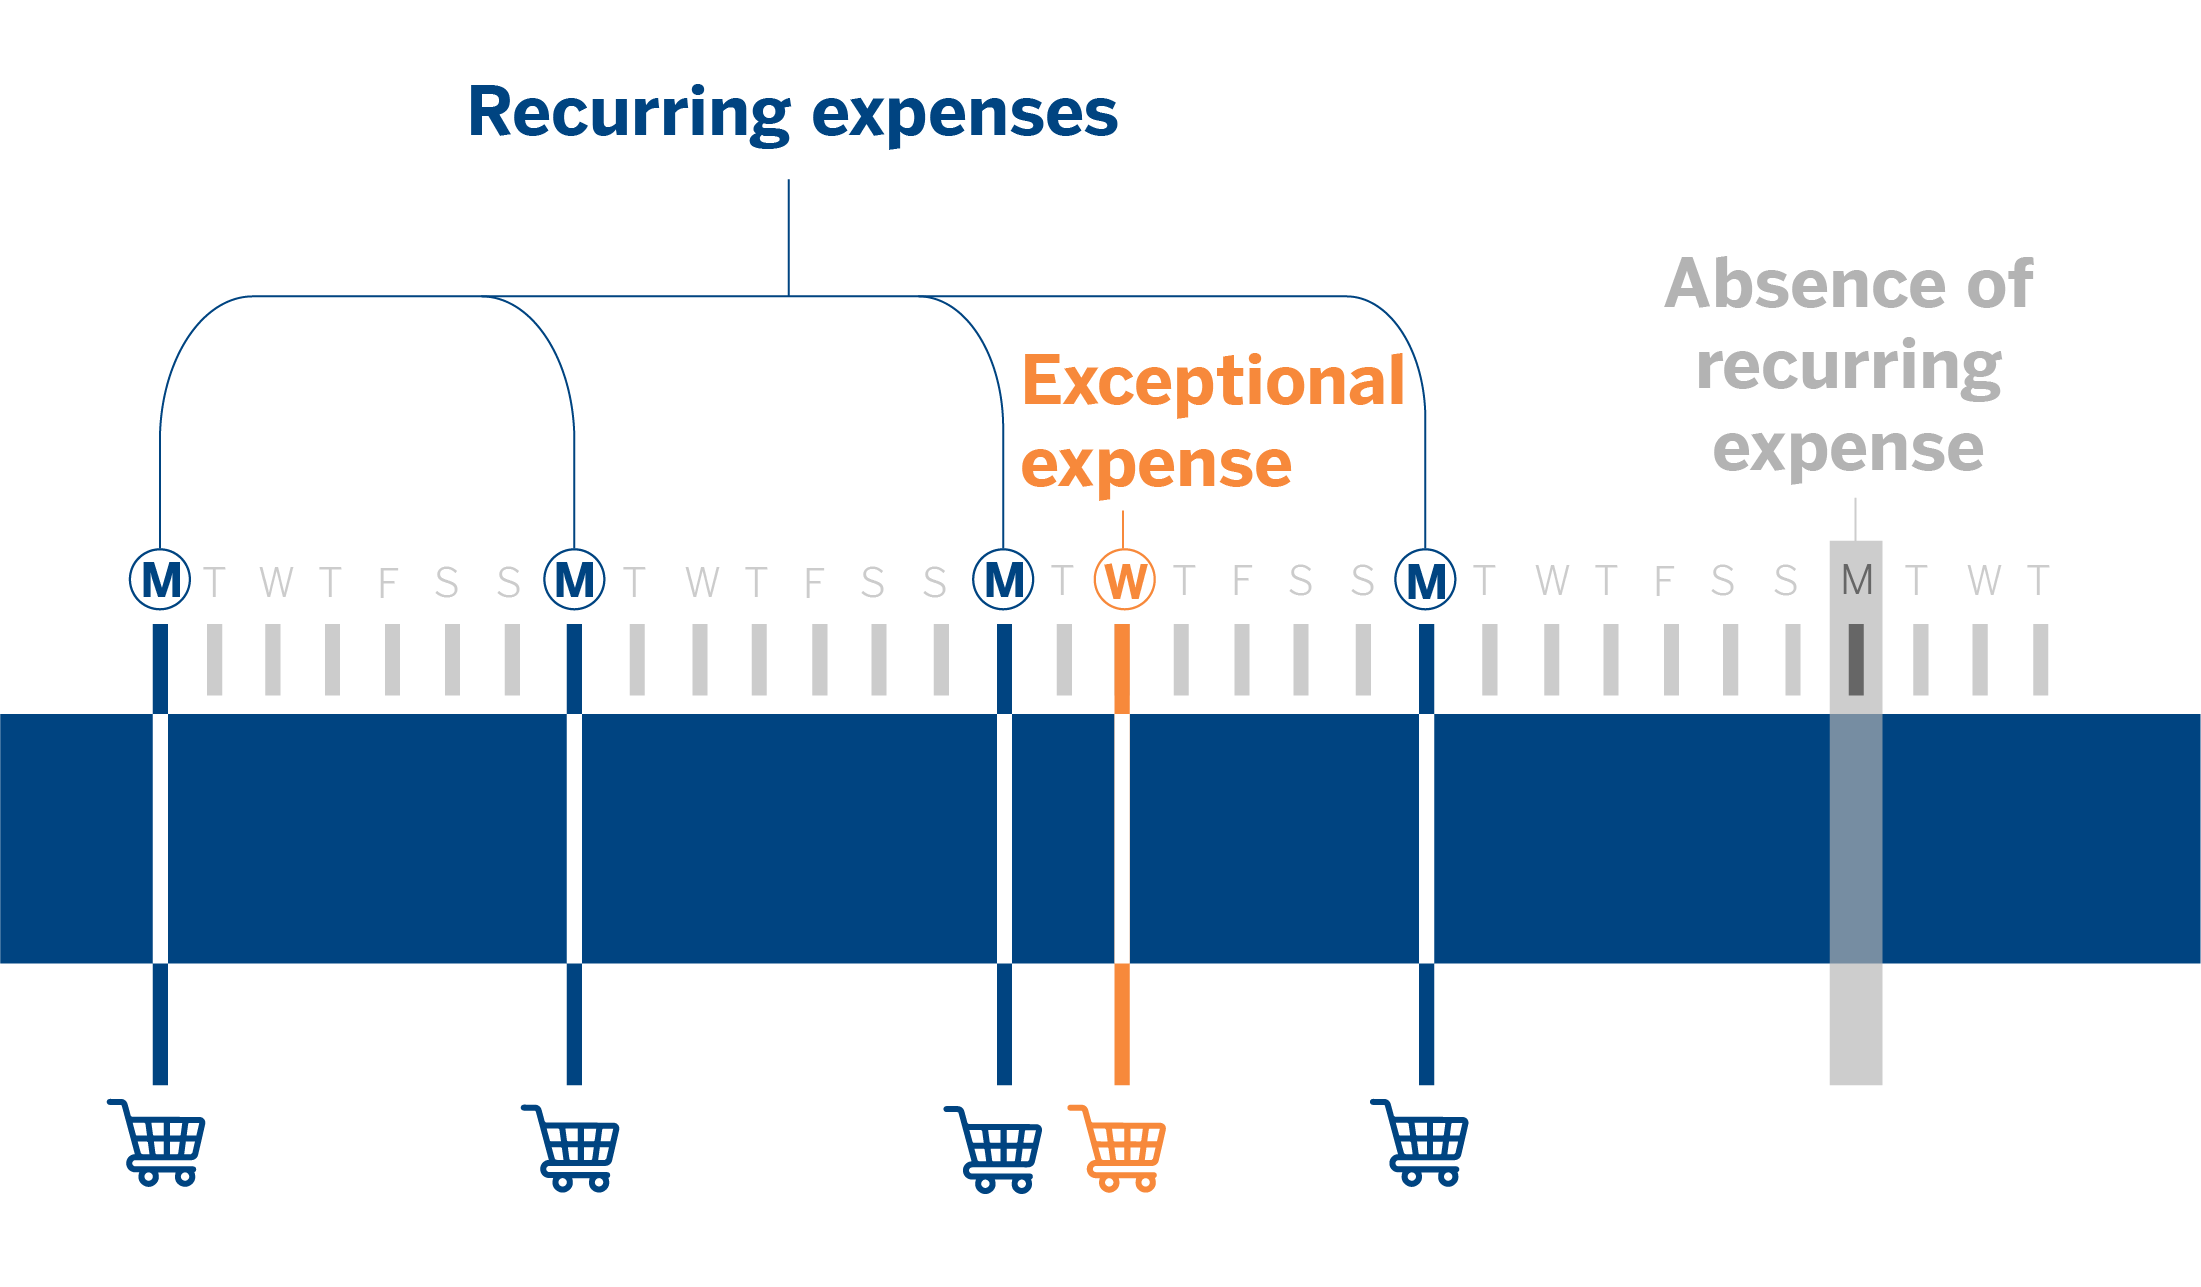
These variations do not indicate a change in habits but are natural exceptions that may occur occasionally. To create an effective pattern detection system, it is essential for the models to differentiate between atypical transactions and genuine changes in the customer’s financial behavior habits.
Methods for detecting financial habits
To understand our clients’ financial habits, we utilize tools that enable the precise identification of recurring patterns and assist us in avoiding misinterpretations that could impact the personalization of our financial health services.
- Pattern detection enables us to identify the cadence of recurring expenses: daily, weekly, monthly, and so on.
- Noise filtering ensures that the analyzed data reflects genuine behaviors, minimizes errors, and enhances the performance of subsequent predictive models.
Although their combined application can improve outcomes in more complex situations, both methods have proven effective on their own.
Detecting patterns: A statistical approach
Financial pattern analysis aims to identify recurrent patterns in customer transactions using robust and interpretable statistical methods.
One of the initial steps is to calculate the time elapsed between consecutive transactions, referred to as “delta-t.” This value indicates the number of days between transactions, helping us identify any consistent intervals.
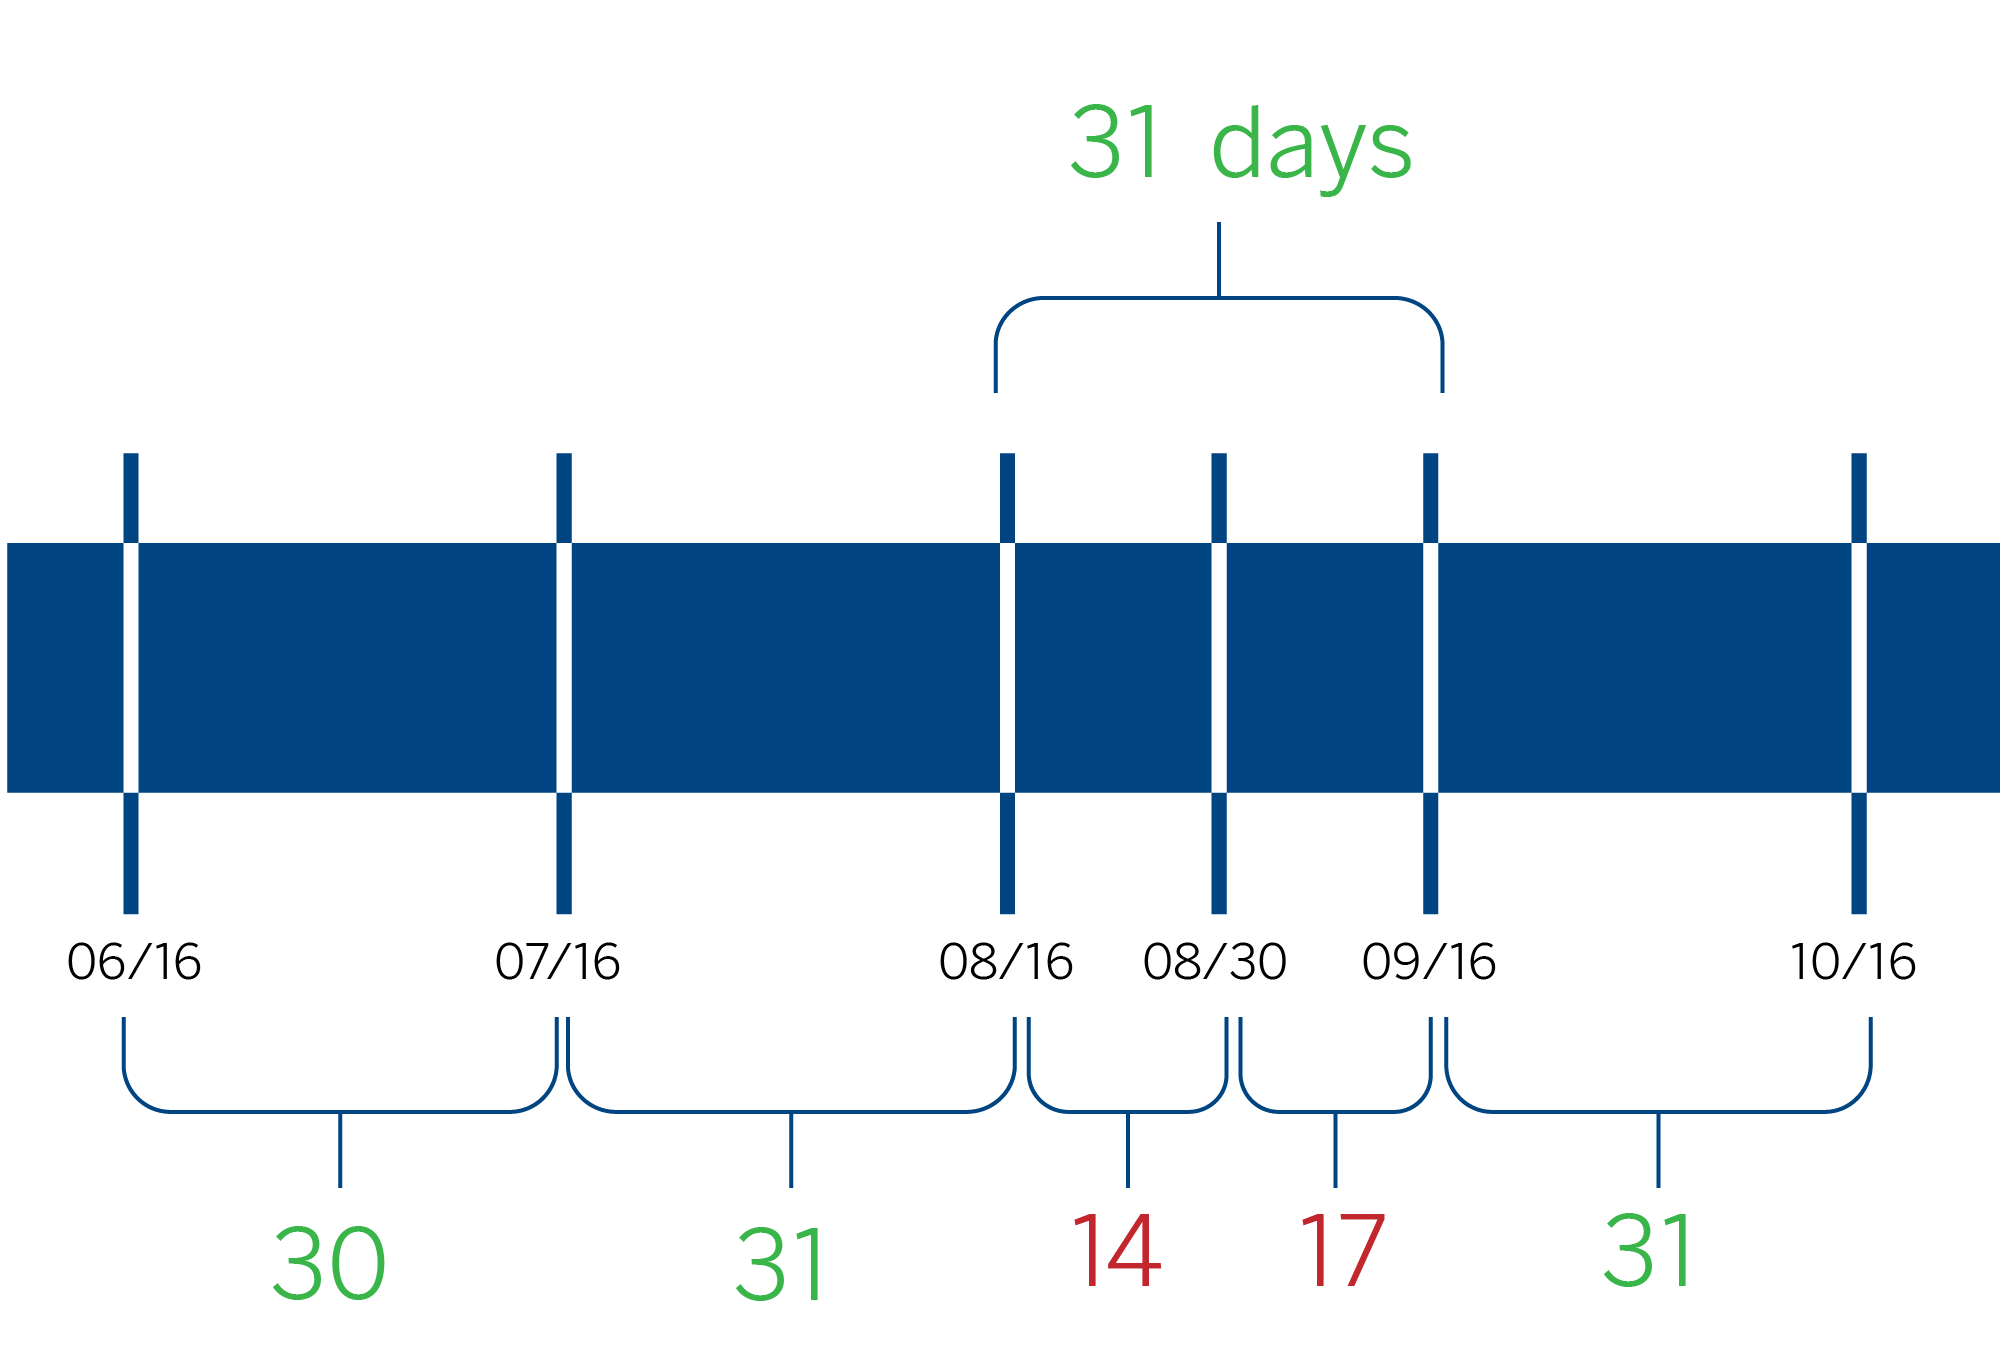
The median of these intervals is calculated based on a defined observation range, such as the last ten transactions. Because the median is less sensitive to extreme values, it provides a more reliable measure of the average time between transactions. With this calculated periodicity, a label is assigned to classify the observed behavior, such as weekly, biweekly, or monthly.
To maintain the quality of the analysis, a tolerance margin is established, representing the number of acceptable days of variation in periodicity. For instance, in the case of a weekly pattern, a margin of one or two days may be acceptable, while for a monthly pattern, this threshold could be extended to five days. This margin allows for the inclusion of transactions that are nearly regular in the analysis.
A habituality score is assigned to measure how consistent the periodicity of transactions is over time. A high score indicates that transactions are highly predictable. This approach not only allows for the ranking of transactions but also enables accurate predictions of future dates.
The challenge: multiple transactions, different memos
One of the biggest challenges in analyzing financial habits occurs when a client makes multiple transactions to the same beneficiary for different purposes. To accurately categorize habitual behavior, it is essential to distinguish between recurrent and exceptional transactions. The description added by the customer to their transactions plays a crucial role in identifying the intention behind each transaction.
A detailed analysis of the transfer memos may reveal isolated transactions (noise) or even multiple distinct purposes. In these situations, it is necessary to segment the transactions into separate groups, each with its own periodicity.
To perform this segmentation, an effective methodology is weighted DBSCAN, an algorithm based on the density and similarities of elements. This algorithm groups transactions with similar concepts, even when they vary in their writing.
After identifying the various purposes, the periodicity of each group can be analyzed using the habituality score. This optimizes the data to provide a clearer understanding of customer habits and enhances the accuracy of predicting future transactions.
Noise filtering: optimizing data quality
Noise filtering is a crucial step to ensure that the analyzed data reflects genuine and consistent patterns. In the context of financial transactions, noise encompasses extraordinary events that do not align with recurring behavior, such as occasional payments or atypical transfers. To tackle this challenge, we have developed a series of algorithms that enable:
 |
DBSCAN method | Eliminating non-recurring transactions. One prominent method is DBSCAN, a density-based clustering algorithm. Unlike the homonymous clustering algorithm, this one is designed to identify groups of transactions with similar characteristics, such as amounts and periodicity. It classifies events that do not fit into any group as noise. |
 |
MATRIX approach | Detecting subsets of events with recurring patterns. Another approach, called MATRIX, uses distance matrices between transactions to find repeating patterns by analyzing time differences and amounts. This method segments complex series into subseries with homogeneous behaviors. |
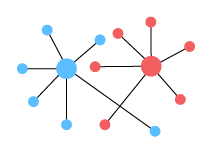 |
GRAPH algorithm | Separating overlapping patterns within complex series. The GRAPH algorithm adopts a directed graph approach to modeling relationships between transactions. Each node represents a transaction, and edges connect transactions that share the same pattern. This approach allows for the identification of the longest paths of recurring events and the separation of overlapping patterns, even in highly noise-contaminated series. |
Challenges: costs, extreme noise, and customer profiles
Although noise filtering is essential for enhancing the accuracy of financial pattern detection, it encounters significant challenges. One primary hurdle is the high computational cost of algorithms like GRAPH, which demands substantial resources to analyze vast datasets and identify clear patterns. Processing this data resembles searching for a needle in a haystack: the larger and more intricate the haystack, the harder it is to pinpoint the relevant information.
Additionally, in environments with extreme noise levels—such as highly irregular transactions or contaminated datasets—models may require careful adjustments to function properly. Identifying the correct thresholds for determining which transactions are considered noise and which are part of valid patterns remains a significant challenge. Inadequate adjustments could result in the removal of relevant transactions or, on the other hand, the retention of irrelevant data that skews the analysis.
Another challenge is the algorithms’ ability to adapt to various customer profiles. While some users exhibit predictable and structured behaviors, others display much more flexible and changing financial habits. Designing models that can dynamically adjust to this diversity remains a central challenge in the research and development of these systems.
Noise filtering: optimizing data quality
Noise filtering is a crucial step to ensure that the analyzed data reflects genuine and consistent patterns. In the context of financial transactions, noise encompasses extraordinary events that do not align with recurring behavior, such as occasional payments or atypical transfers. To tackle this challenge, we have developed a series of algorithms that enable:
DBSCAN method
Eliminating non-recurring transactions. One prominent method is DBSCAN, a density-based clustering algorithm. Unlike the homonymous clustering algorithm, this one is designed to identify groups of transactions with similar characteristics, such as amounts and periodicity. It classifies events that do not fit into any group as noise.
MATRIX approach
Detecting subsets of events with recurring patterns. Another approach, called MATRIX, uses distance matrices between transactions to find repeating patterns by analyzing time differences and amounts. This method segments complex series into subseries with homogeneous behaviors.
GRAPH algorithm
Separate overlapping patterns within complex series. The GRAPH algorithm adopts a directed graph approach to modeling relationships between transactions. Each node represents a transaction, and edges connect transactions that share the same pattern. This approach allows for the identification of the longest paths of recurring events and the separation of overlapping patterns, even in highly noise-contaminated series.
Challenges: costs, extreme noise, and customer profiles
Although noise filtering is essential for enhancing the accuracy of financial pattern detection, it encounters significant challenges. One primary hurdle is the high computational cost of algorithms like GRAPH, which demands substantial resources to analyze vast datasets and identify clear patterns. Processing this data resembles searching for a needle in a haystack: the larger and more intricate the haystack, the harder it is to pinpoint the relevant information.
Additionally, in environments with extreme noise levels—such as highly irregular transactions or contaminated datasets—models may require careful adjustments to function properly. Identifying the correct thresholds for determining which transactions are considered noise and which are part of valid patterns remains a significant challenge. Inadequate adjustments could result in the removal of relevant transactions or, on the other hand, the retention of irrelevant data that skews the analysis.
Another challenge is the algorithms’ ability to adapt to various customer profiles. While some users exhibit predictable and structured behaviors, others display much more flexible and changing financial habits. Designing models that can dynamically adjust to this diversity remains a central challenge in the research and development of these systems.
Conclusions for financial habits anaylisis
Unlike perfectly timed events, human transactions differ in frequency and periodicity. These variations can complicate the identification of clear patterns and lead to inaccuracies in predicting financial habits.
Despite this, both noise filtering and pattern detection provide a strong foundation for understanding and predicting customers’ financial habits. The ongoing enhancement of these algorithms and their capacity to be tailored to individual needs will enable us to tackle these challenges and deliver increasingly accurate and valuable solutions.