
Explaining the reliability of algorithms to humans
In 2018, coinciding with the Football World Cup, a company ventured to forecast the probabilities of each team becoming champion -the original report is not available but you can still read some posts in the media that covered the story-. Germany topped the list, with a 24% probability. As soon as Germany was eliminated from the group stages, the initial forecast was viewed as being mistaken, which led to the anecdote circulating on social networks.
The problem wasn’t the model itself, of which no details were revealed, although it was said to be based on a simulation methodology, and robust sports forecasting models are known -BTW, for the occasion of the World Cup, BBVA AI Factory also created a visualization of player and team data-. However, the problem was not the report either because it didn’t draw the conclusion that only Germany would win.
The main problem was the interpretation of the result provided by certain media and the wider public who assumed that ‘Germany wins’ would prove to be right even if the numbers said indicated otherwise: the probability was so fragmented, that a 24% for Germany meant that there was a 76% chance that any other team would win, right?
The human tendency to simplify: the “wet bias”
The fact that humans are not good at evaluating probability-based scenarios, is well known to meteorologists. In 2002, a phenomenon called “wet bias” was unveiled: it was observed that meteorological services in some American media were used to deliberately inflate the probability of rain to be much higher than had actually been calculated. In his well-known book “The Signal and the Noise”, the statistician and data disseminator Nate Silver delves into this phenomenon and goes so far as to attribute it to the fact that meteorologists believe that the population, whenever it sees a probability of rain that is too small -say 5%-, will interpret it directly as “it’s not going to rain” -and consequently will be disappointed 5% of the time-.
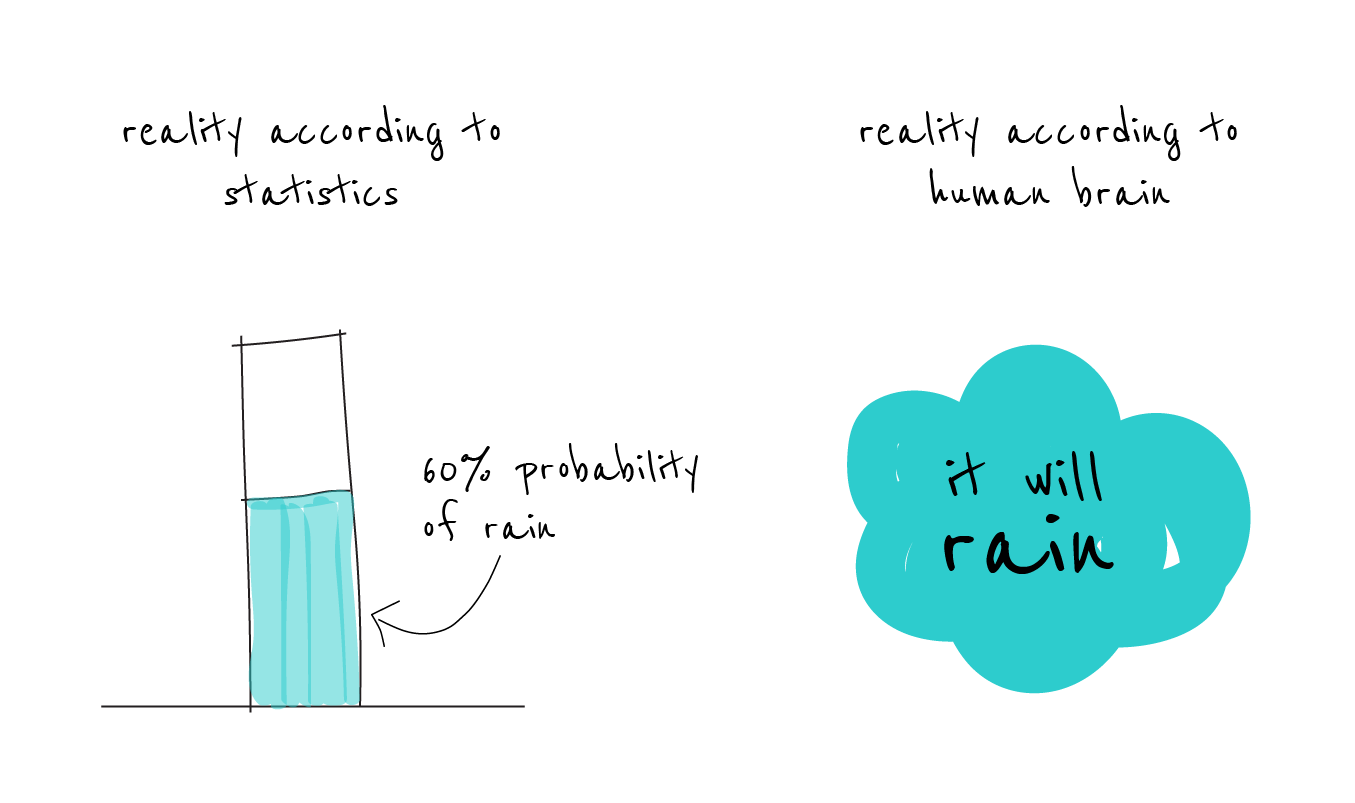
This suggests that humans tend to simplify information for decision making. The fact is that the 5% chance of rain, or the 24% chance that Germany would win the World Cup, should not be transformed into a black and white decision, but should be taken as information for analysing scenarios. Nate Silver, in his post “The media has a probability problem” or in his last talk at Spark Summit 2020, analyzes this limitation to build scenarios given some probabilities, illustrating it with examples of hurricane forecasting or the 2016 US elections. As Kiko Llaneras argues in his article “En defensa de la estadística” (in Spanish), every prediction has to fall on the improbable side sometime or other.
Designing algorithms correctly from scratch
Those of us who work with Machine Learning in the design of customer-oriented products believe that we should not reproduce that same error of taking the results of forecasts as absolute. It is up to us to properly understand what level of confidence a Machine Learning system has in the result it offers, and to accurately transmit it to the receivers of the information.
For example, if we want to design an algorithm to forecast the expenses that a customer will have and to inform them through the BBVA app, we are interested in being able to analyze how confident the algorithm is in each forecast, and perhaps discard the cases where we do not have high confidence.
Surprisingly, many forecasting algorithms are designed in such a way that they can induce a similar misinterpretation to the one we described in the case of the World Cup. This is because the estimate provided by a forecast model (for example, next month’s expenditure), which takes information observed in the past (expenditure from previous months) results in the form of a single value. And we’ve already discussed what could happen if we reduce everything only to the most likely value. It would be more interesting if the system were able to provide a range -the expenditure will be between 100 and 200 euros-, and aim to reduce the range when it is very certain -for example in the case of a recurrent fixed expenditure-. The system could also extend that range if it is more uncertain, case by case -for example in the case of a holiday, where our expenditure is less predictable-.
At BBVA AI Factory we have worked on a research area, together with the University of Barcelona, to try to develop this type of algorithm using neural network forecasting techniques. This research had already been discussed in other posts and has resulted in publications, including one at the prestigious NeurIPS 2019 conference1.
Thanks to this research, we now have algorithms capable of providing forecasts that result in a range of uncertainty, or a mathematical distribution function, rather than a single value, which offers us more complete information.
Can we trust the black boxes? (Spoiler: Yes, with some tricks)
However, we have to face one more obstacle: offentimes data science teams use models that they did not create themselves: models from others, from external code libraries or APIs, or from software packages. We have a forecasting system that is already in place -for example, next month’s expense estimate, or a balance estimate for the following few days-, and for some good reason it cannot be replaced. The question begs: can we design another algorithm that estimates how confident the first algorithm is, without having to replace it or even modify it?
The response is positive and has been described in our recent article, “Building Uncertainty Models on Top of Black-Box predictive APIs“, published in IEEE Access and signed by authors Axel Brando, Damià Torres, José A. Rodríguez Serrano and Jordi Vitrià from BBVA AI Factory and the University of Barcelona. We describe a neural network algorithm that transforms the prediction given by any existing system into a range of uncertainty. We distinguish two cases: firstly, where we know the details of the system we want to improve. However, we also deal with the case where the system we want to improve is a black box, i.e, a system that we use to generate forecasts but which cannot be modified. Nor do we not know how it has been built. A common real-life scenario, for example, when using software from a supplier.
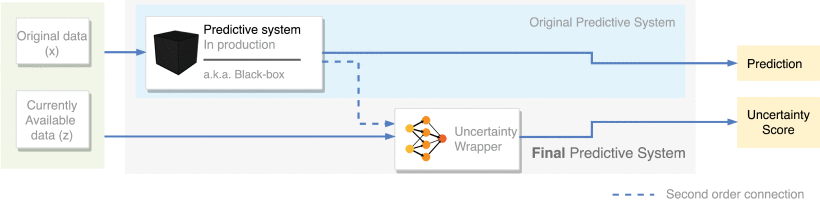
This opens up the possibility of using any available forecasting system, which works by giving point estimates and, without having to modify it, “augmenting” it with the ability to provide a range of uncertainty, as schematically shown in the figure above. We have verified the system in cases of bank forecasting and in cases of electricity consumption prediction. We are providing the link to the article so that other researchers, data scientists or interested people can consult the details.
The challenge: translating reliability into a human language
With this work, we have achieved the challenge of designing a forecasting system that provides extra information. However, the key question we raised at the beginning remains unanswered: if we build products based on Machine Learning, how do we transfer this information to the end user in a way that they understand that it is a useful estimate, but might present errors?
This is still an open issue. Recently, a presentation by Apple on product design with Machine Learning shed some light on this aspect, and suggested communicating uncertain information in terms of some amount that appeals to the user. Better to say “if you wait to book, you could save 100 euros”, than “the probability of the price going down is 35%”. The latter formula -the most commonly used- could give rise to the same interpretation problems that occurred with the case of Germany in the World Cup. If humans are not statistically minded animals, perhaps the challenge is in the language.