
This is how we integrate browsing data to enhance our analytical models
One of the most widespread applications of artificial intelligence is developing analytical models that enable us to provide more personalized experiences and recommend products and services that best meet customers’ needs. As we enhance the performance of our models, our proposals become increasingly relevant and suitable for each individual.
In this article, we begin with a hypothesis: user navigation in the BBVA app represents valuable information that can greatly enhance the performance of our models and, consequently, their predictions.
To take advantage of this information, we first transform the browsing data into embeddings, which are vector representations that encode this data for easier processing by the models. Next, we incorporate these embeddings into our models and adjust them according to the specific requirements of each use case.
In this article, we will delve into the application of navigation embeddings in a particular scenario: the creation of propensity models that assist in forecasting the likelihood of a customer purchasing a product or service.
How do we create client embeddings based on browsing data?
One of our teams at AI Factory has recently been exploring ways to convert users’ navigation into vector representations, or embeddings, that can be seamlessly integrated into BBVA’s predictive models.
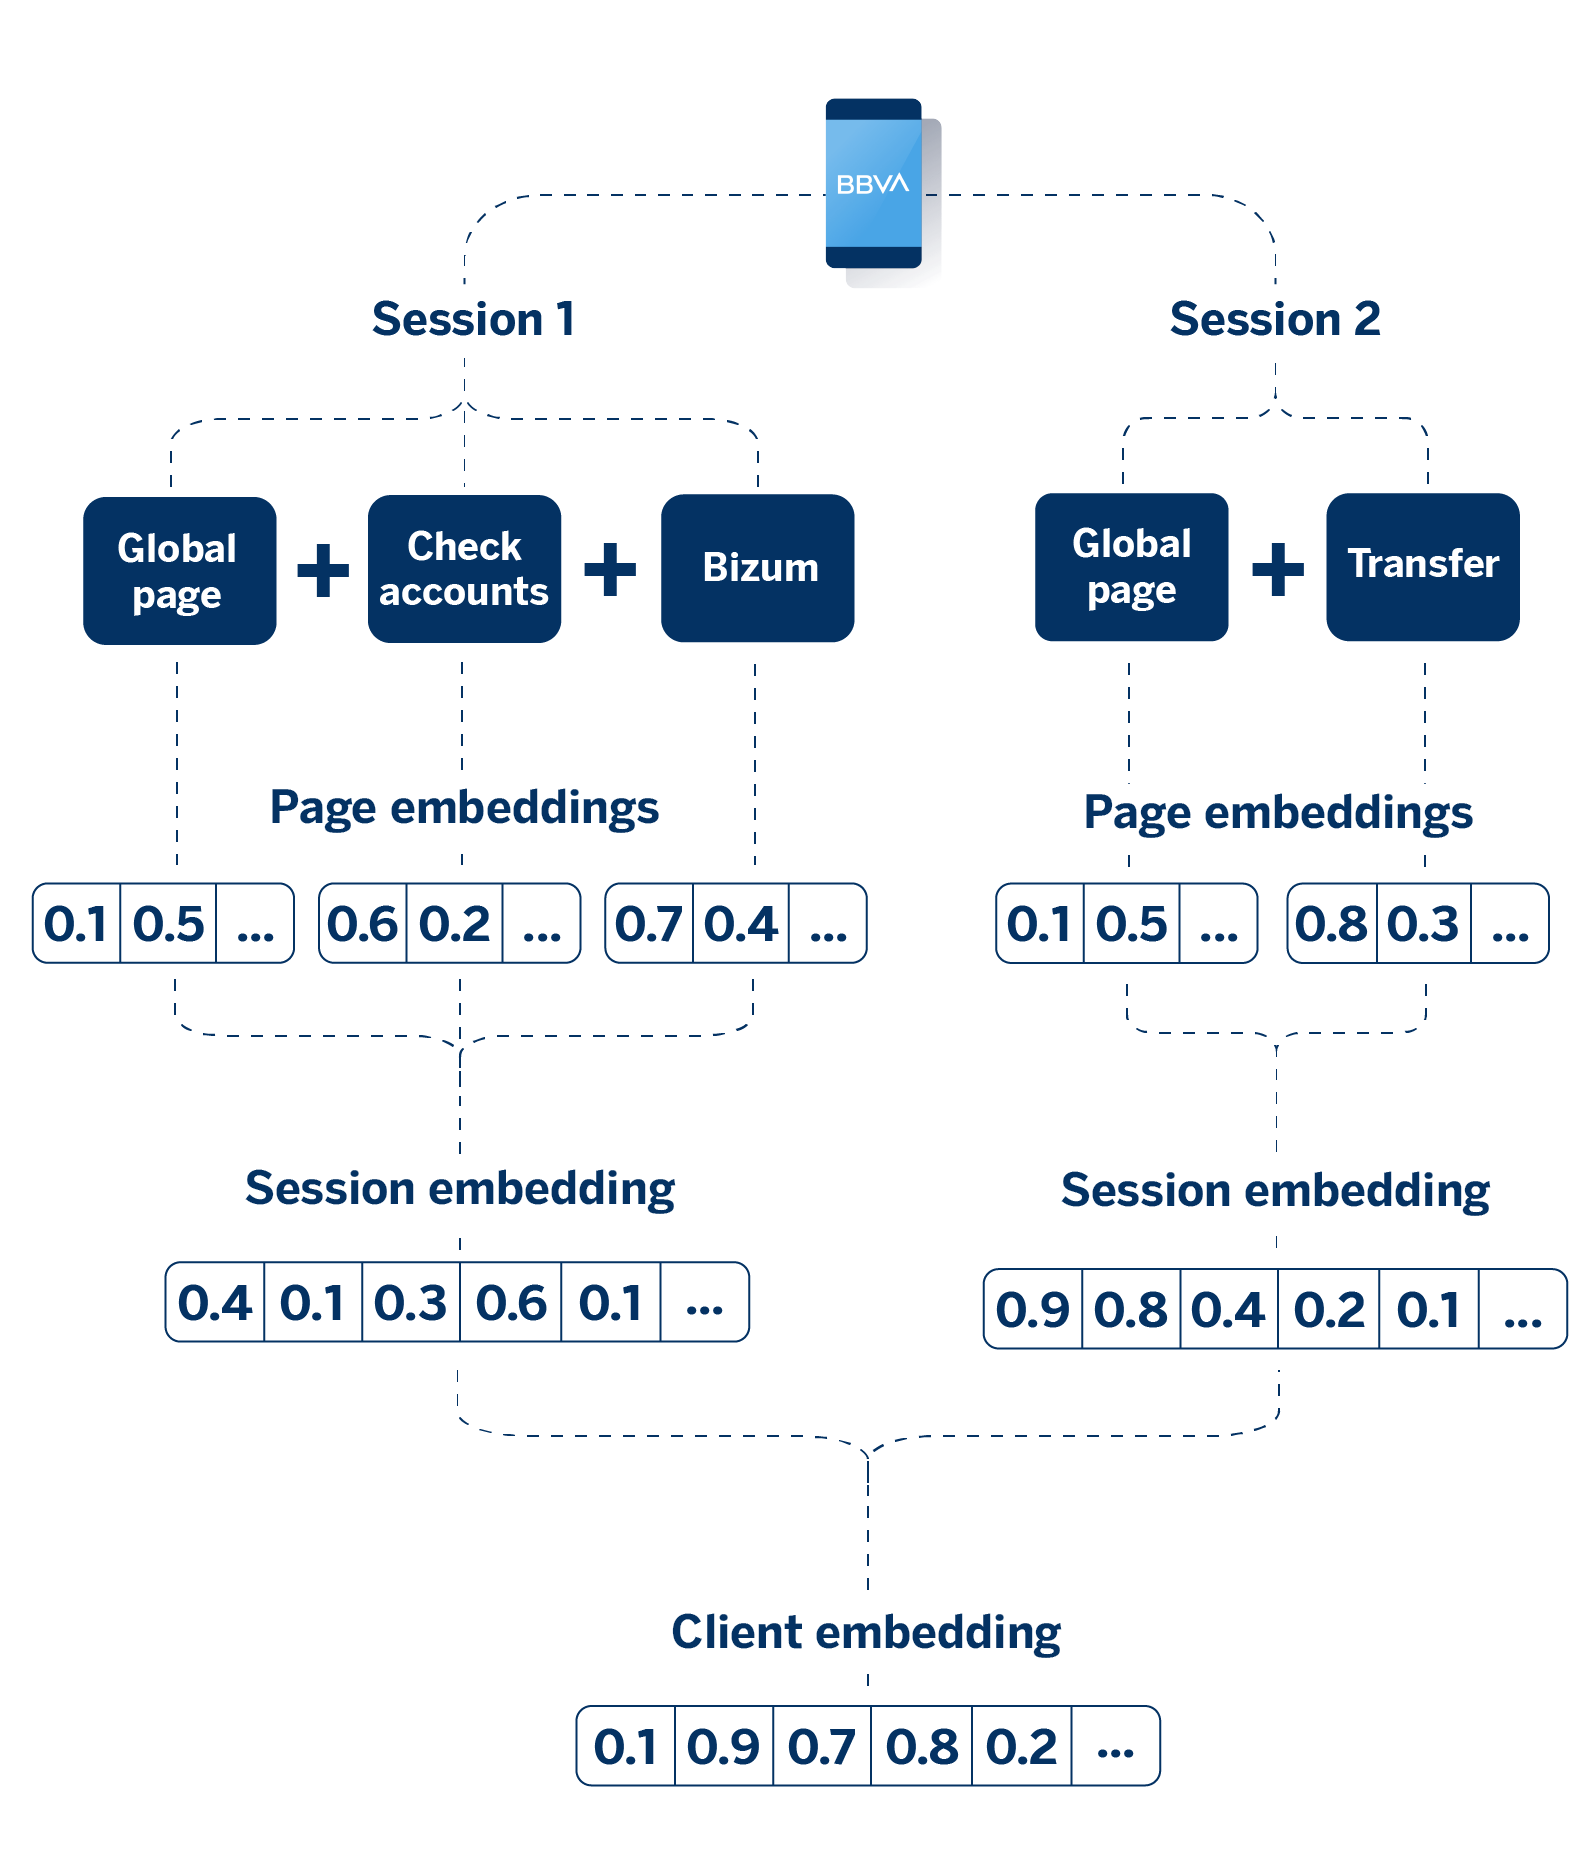
User browsing in the BBVA app—specifically, the route taken through various pages—can be translated into a numerical format. This is done using a mathematical model that encapsulates the key relationships among different navigation elements, ensuring that the mathematical space accurately reflects the connections between the app’s pages.
Once the embeddings of each visited page are available, they can be aggregated in various ways (average, sum, non-linear transformations, etc.) to represent more complex interactions. For example, if a customer browses several pages during their session, we can aggregate the vectors of these pages to create a single embedding that represents the entire browsing session.
This aggregation process allows us to condense the information from multiple interactions into a single, coherent representation. In line with this reasoning, when a user has engaged in multiple browsing sessions, it’s also possible to combine the embeddings from all these sessions to form a comprehensive representation of their behavior over time.
Application to a specific use case: Propensity models
Next, we will utilize customer navigation embeddings for a targeted project: creating propensity models. These models aim to predict how likely a customer is to buy a product or service, such as a loan, credit card, or insurance.
To achieve this, these models include a set of variables that outline the customer’s profile, financial situation, and historical behavior. At this stage, browsing information in the BBVA app can assist in identifying customer preferences and interests.
Traditionally, these navigation variables were generated through complex ETL processes based on predefined hypotheses. Now, by applying navigation embeddings, the models have new variables that capture more complete and accurate customer browsing information.
The browsing information provided by embeddings can be utilized in various models and use cases, saving time and preventing ad-hoc processes for each new project.
Explainability: The challenge
Embeddings pose an explainability challenge because these vectors exist in a latent space. This makes it difficult to interpret individual dimensions, which in turn hampers the business unit’s understanding of the model’s outputs.
To tackle this challenge, we can utilize dimensionality reduction and feature importance analysis techniques, along with intermediate transformations (as outlined below), that clarify the labels linked to each group of interactions. These methods enable us to achieve a balance between embeddings’ predictive strength and the transparency essential for informed decision-making.
Explainability requirements for models differ from project to project. In this case, we will perform several of the operations mentioned above, as we need to understand what specific information is gathered by the variables on which the model is based in order to make accurate predictions.
Integrating browsing data into the propensity model: Our analytical workflow
By applying the following analytical workflow, we have managed to improve the propensity model’s performance by incorporating navigation embeddings. In the next section, we outline the steps involved in this process.
Base model: The starting point
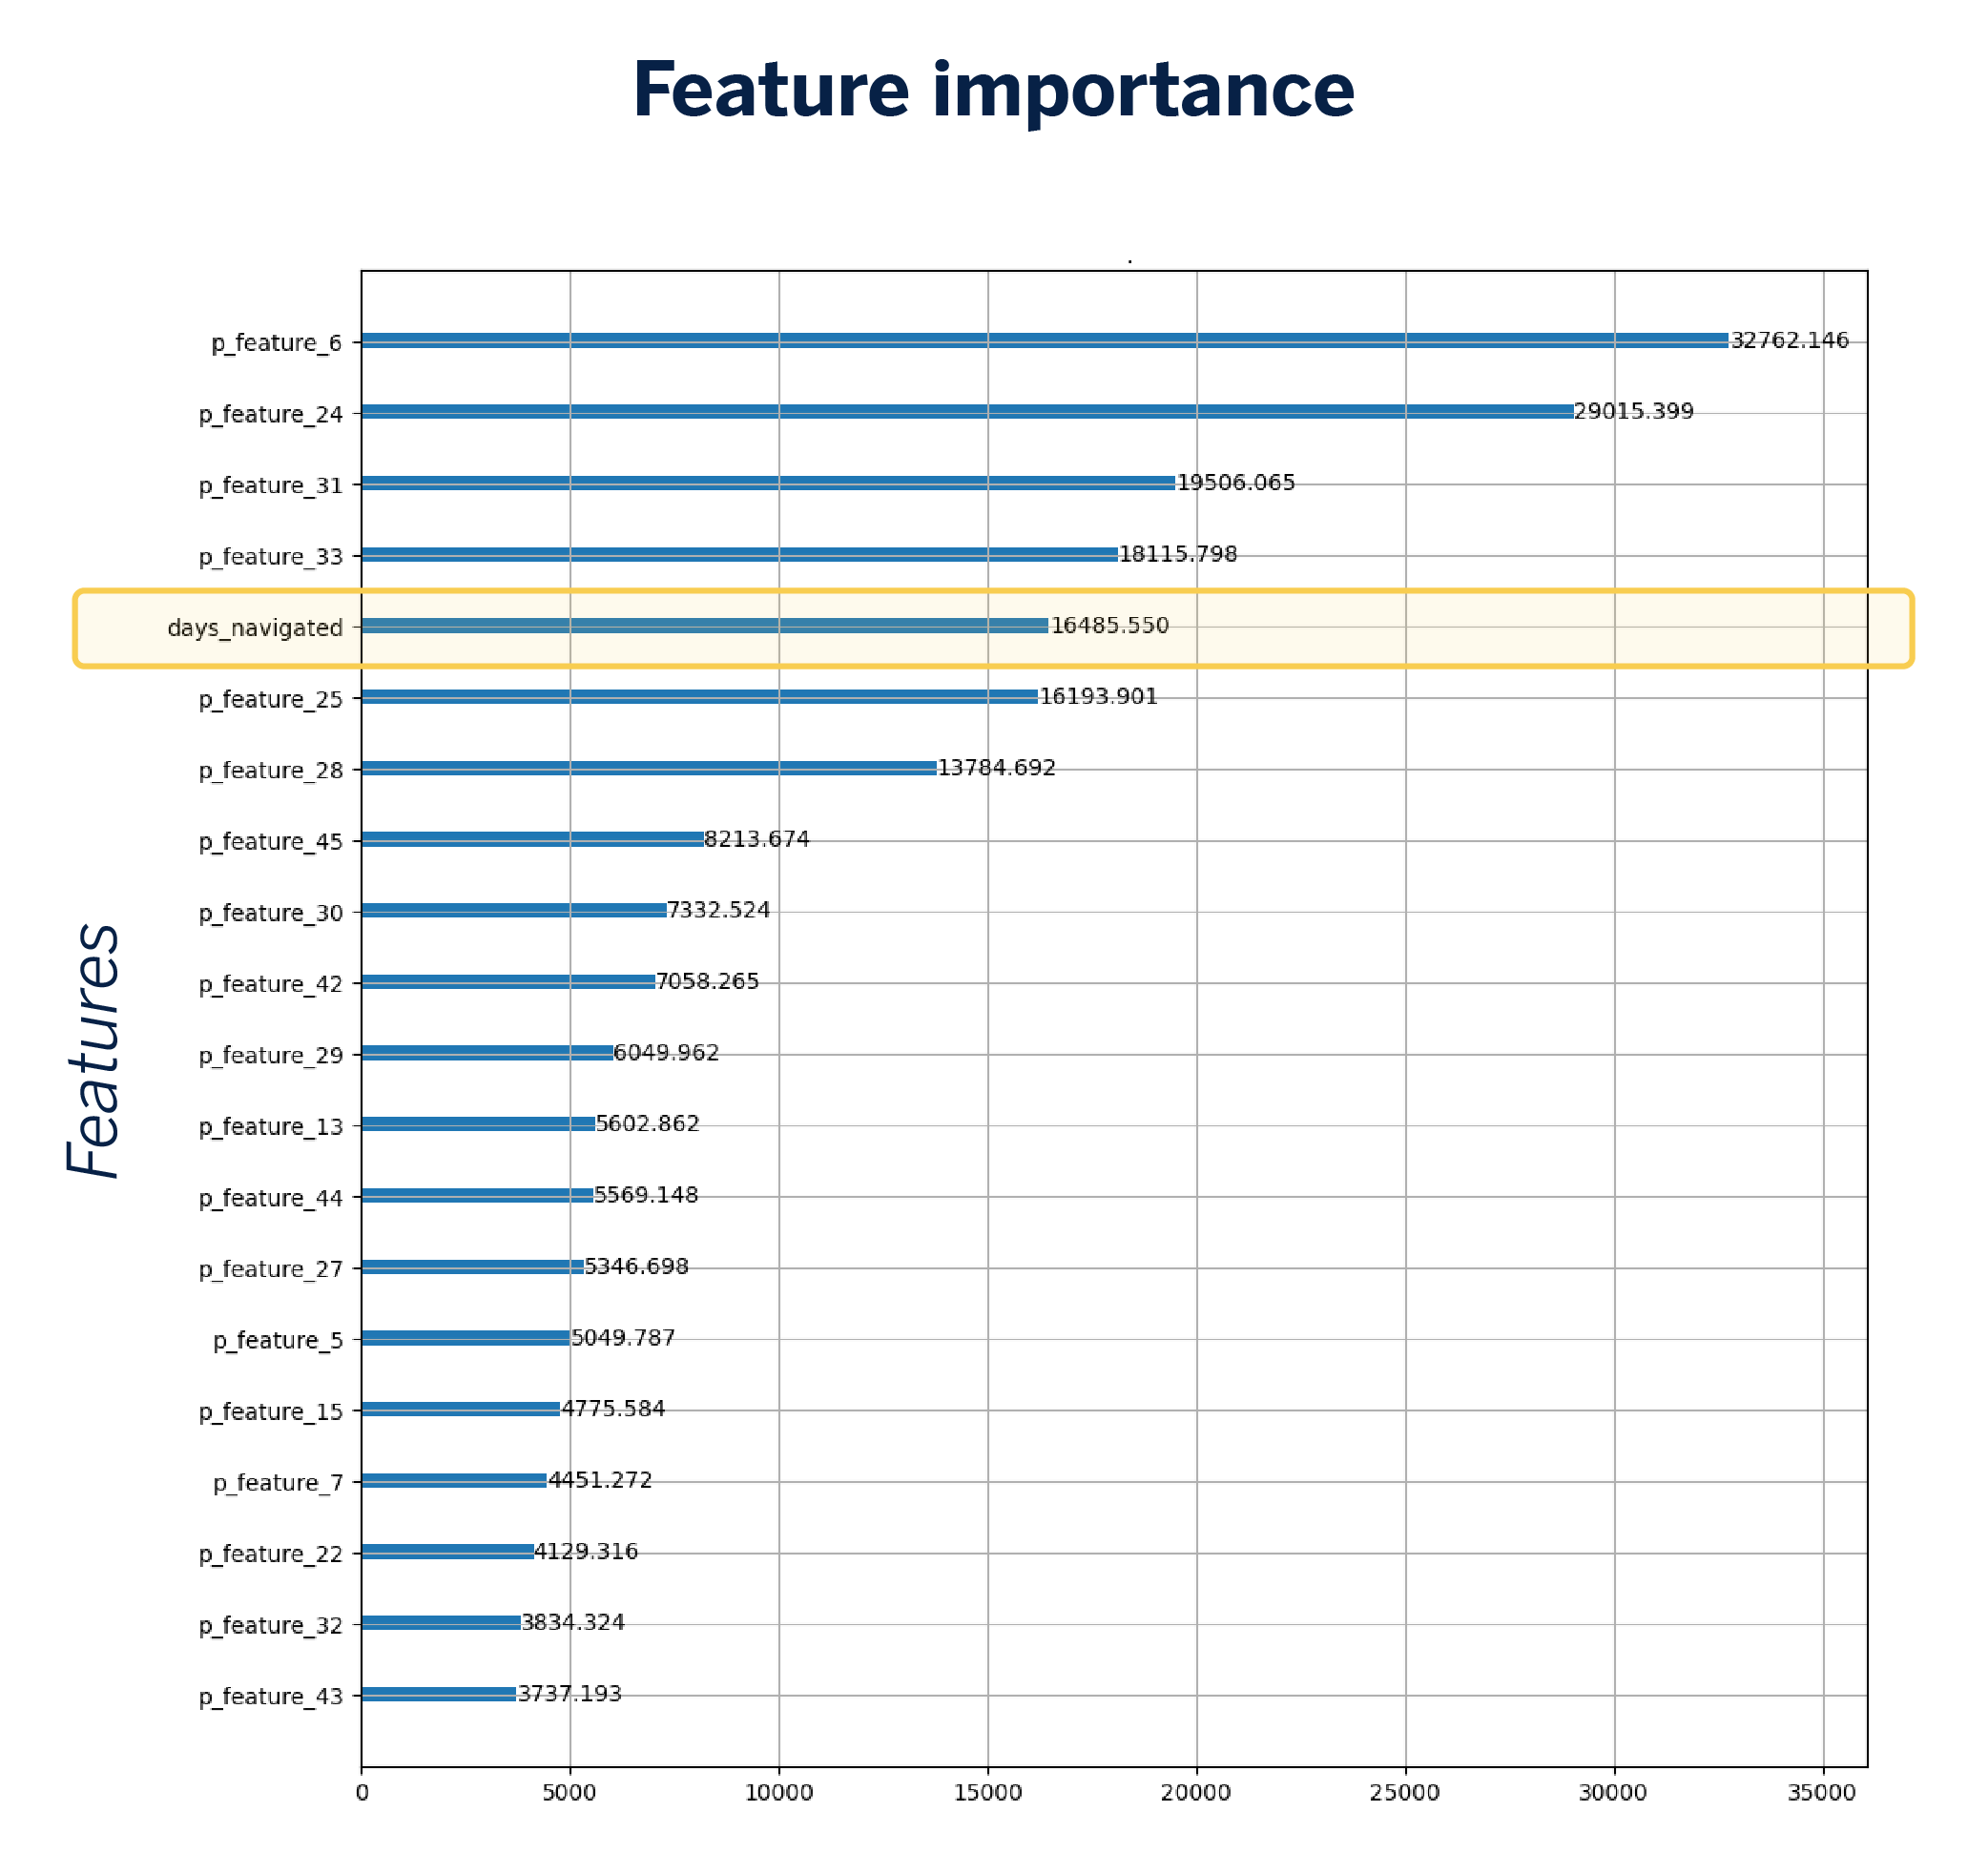
Initially, it’s crucial to set a baseline that gives us the current propensity model based on conventional variables. This baseline utilizes 32 features, including the number of days a customer has engaged with the application. This particular variable is notable, prompting us to theorize that browsing-related factors may significantly influence predictions.
Introduction of navigation embeddings: Leveraging the existing model with browsing data
The first action we will take is to incorporate the vector representation of the user’s navigation into our model, meaning the embeddings we computed earlier, while still retaining the traditional navigation variables. These embeddings broaden the input space, leading to an increase in the number of variables in the model from 32 to 72.
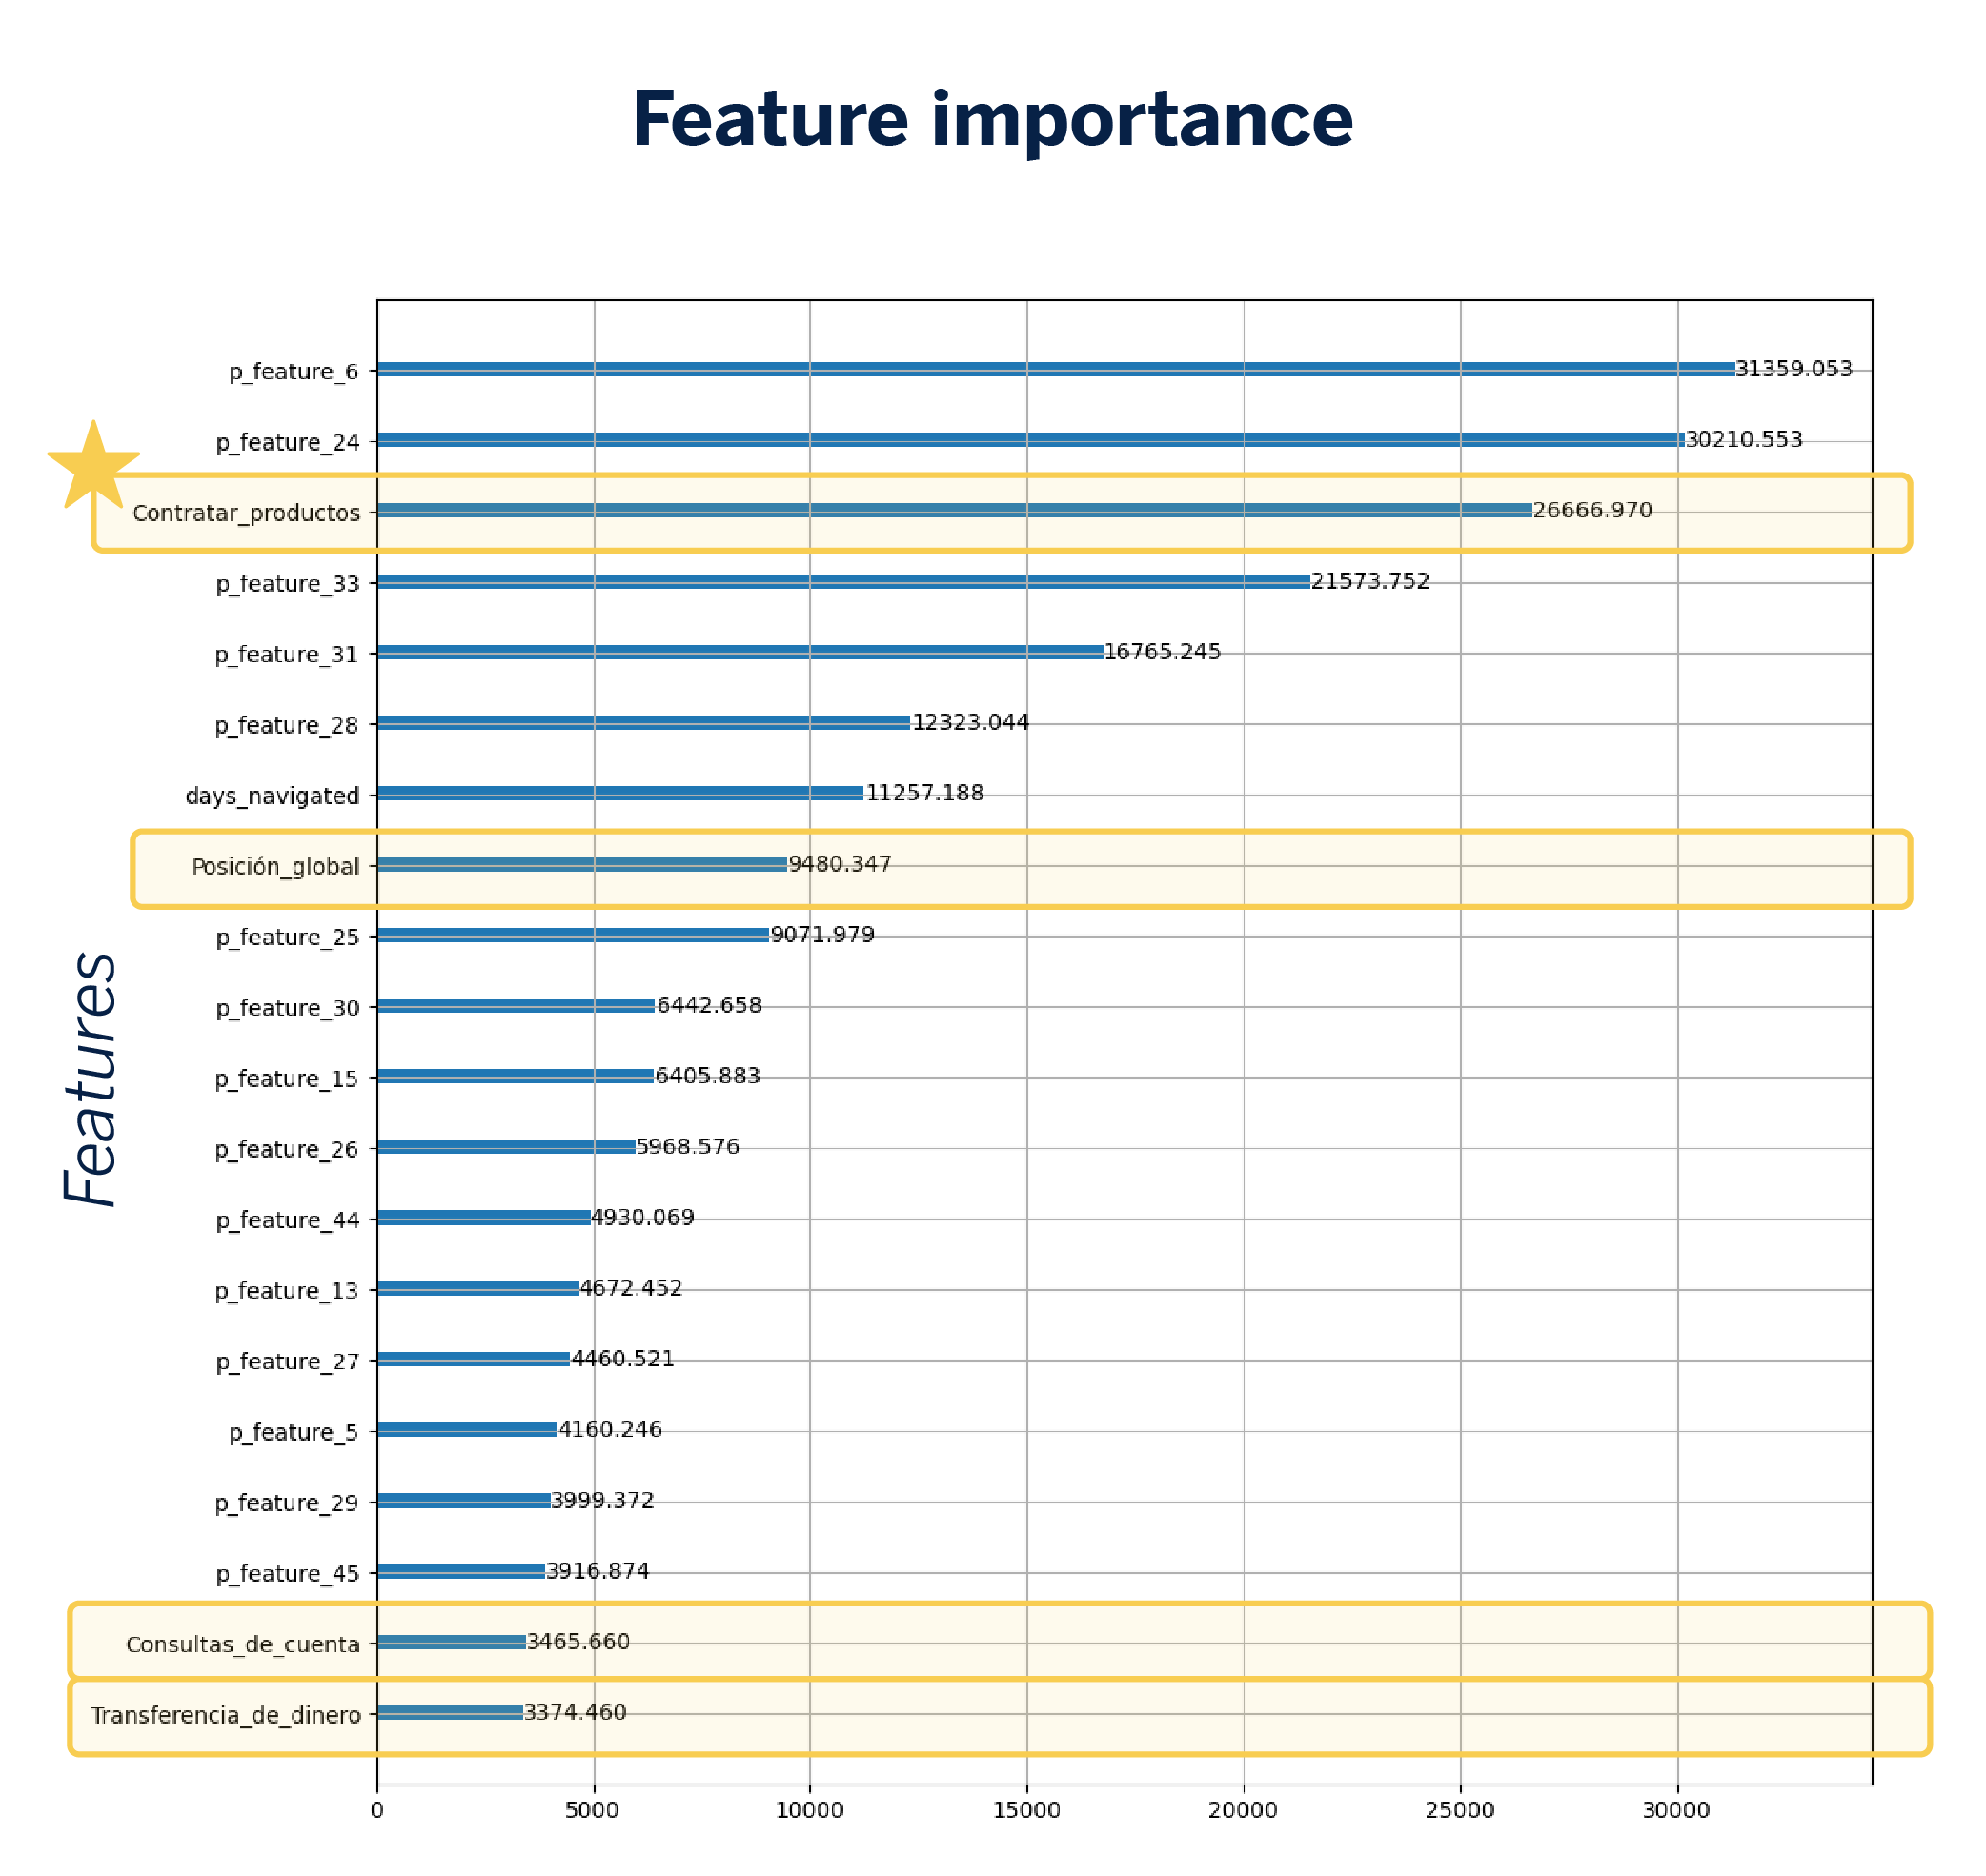
The introduction of embeddings leads to a slight increase in AUC, showing an enhancement in model performance. A feature importance plot reveals that specific dimensions of the embeddings act as important variables, highlighting their capacity to uncover significant browsing patterns.
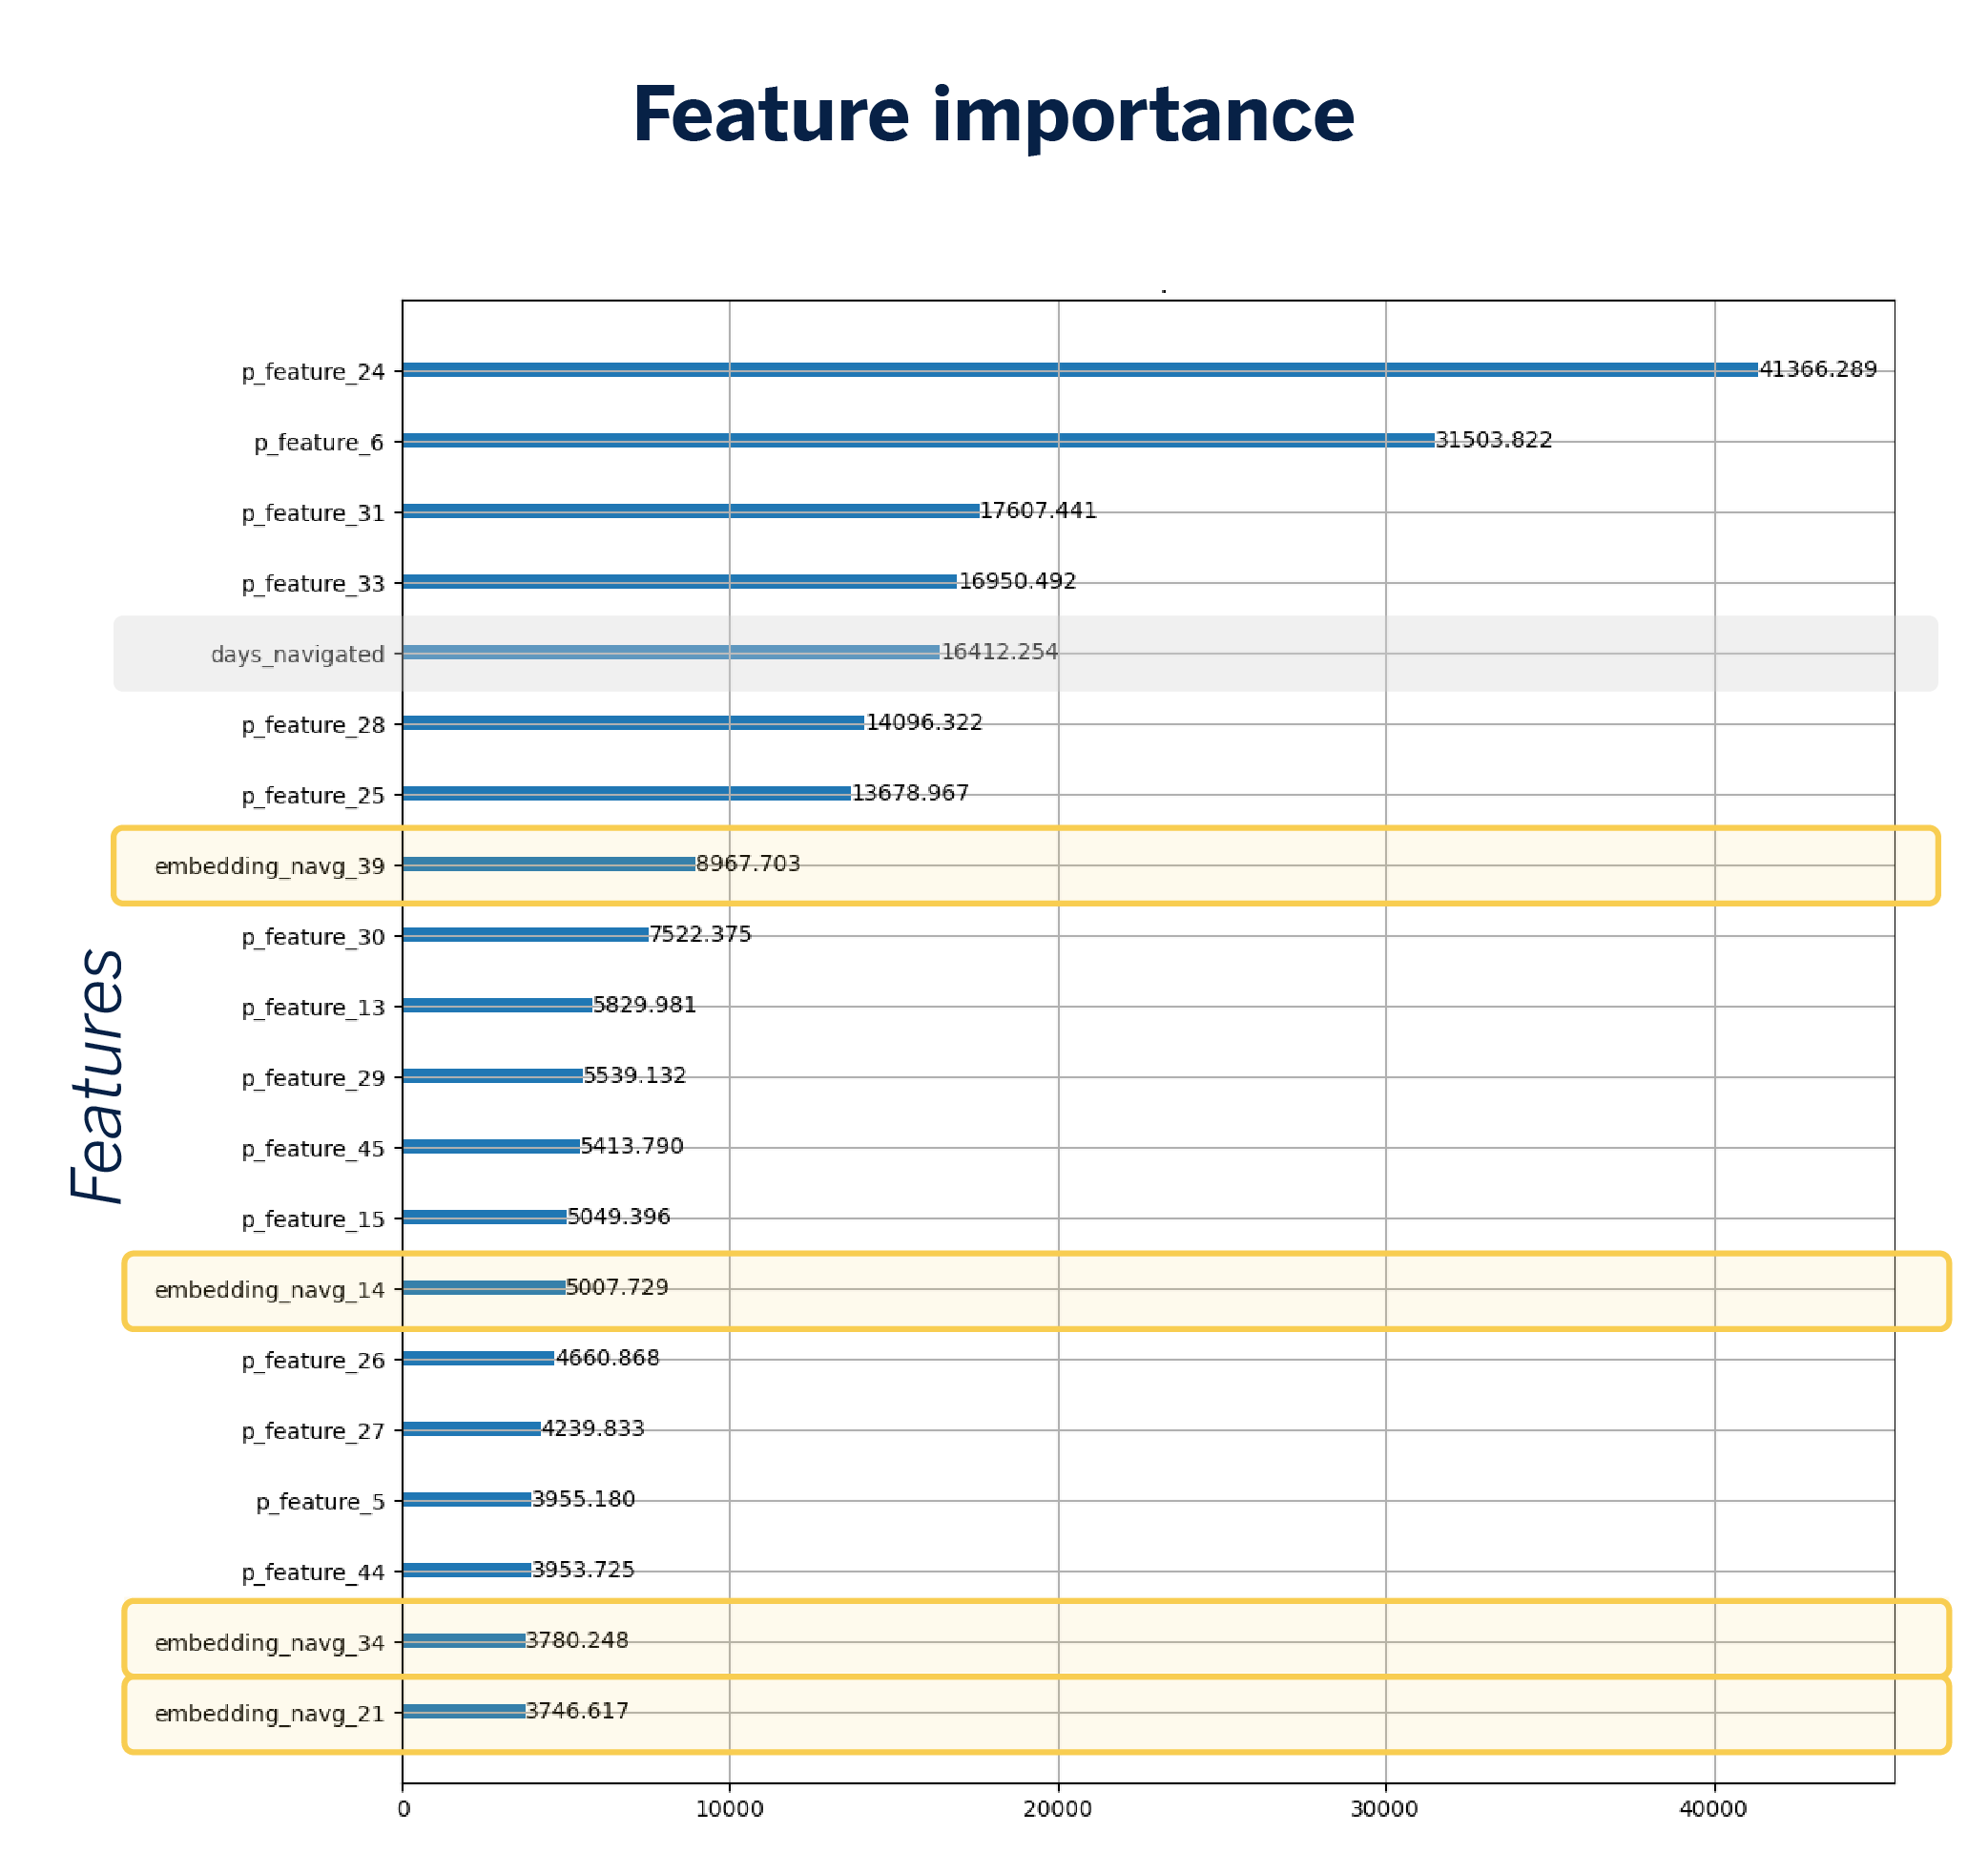
However, at this point, the challenge of explainability arises. Since we do not know what each embedding dimension represents, we will not be able to satisfactorily explain the results obtained to the business unit.
NavTagging: Addressing explainability
To tackle the challenge of explainability, we introduce the concept of NavTagging, which involves tagging customer browsing sessions to enhance their clarity.
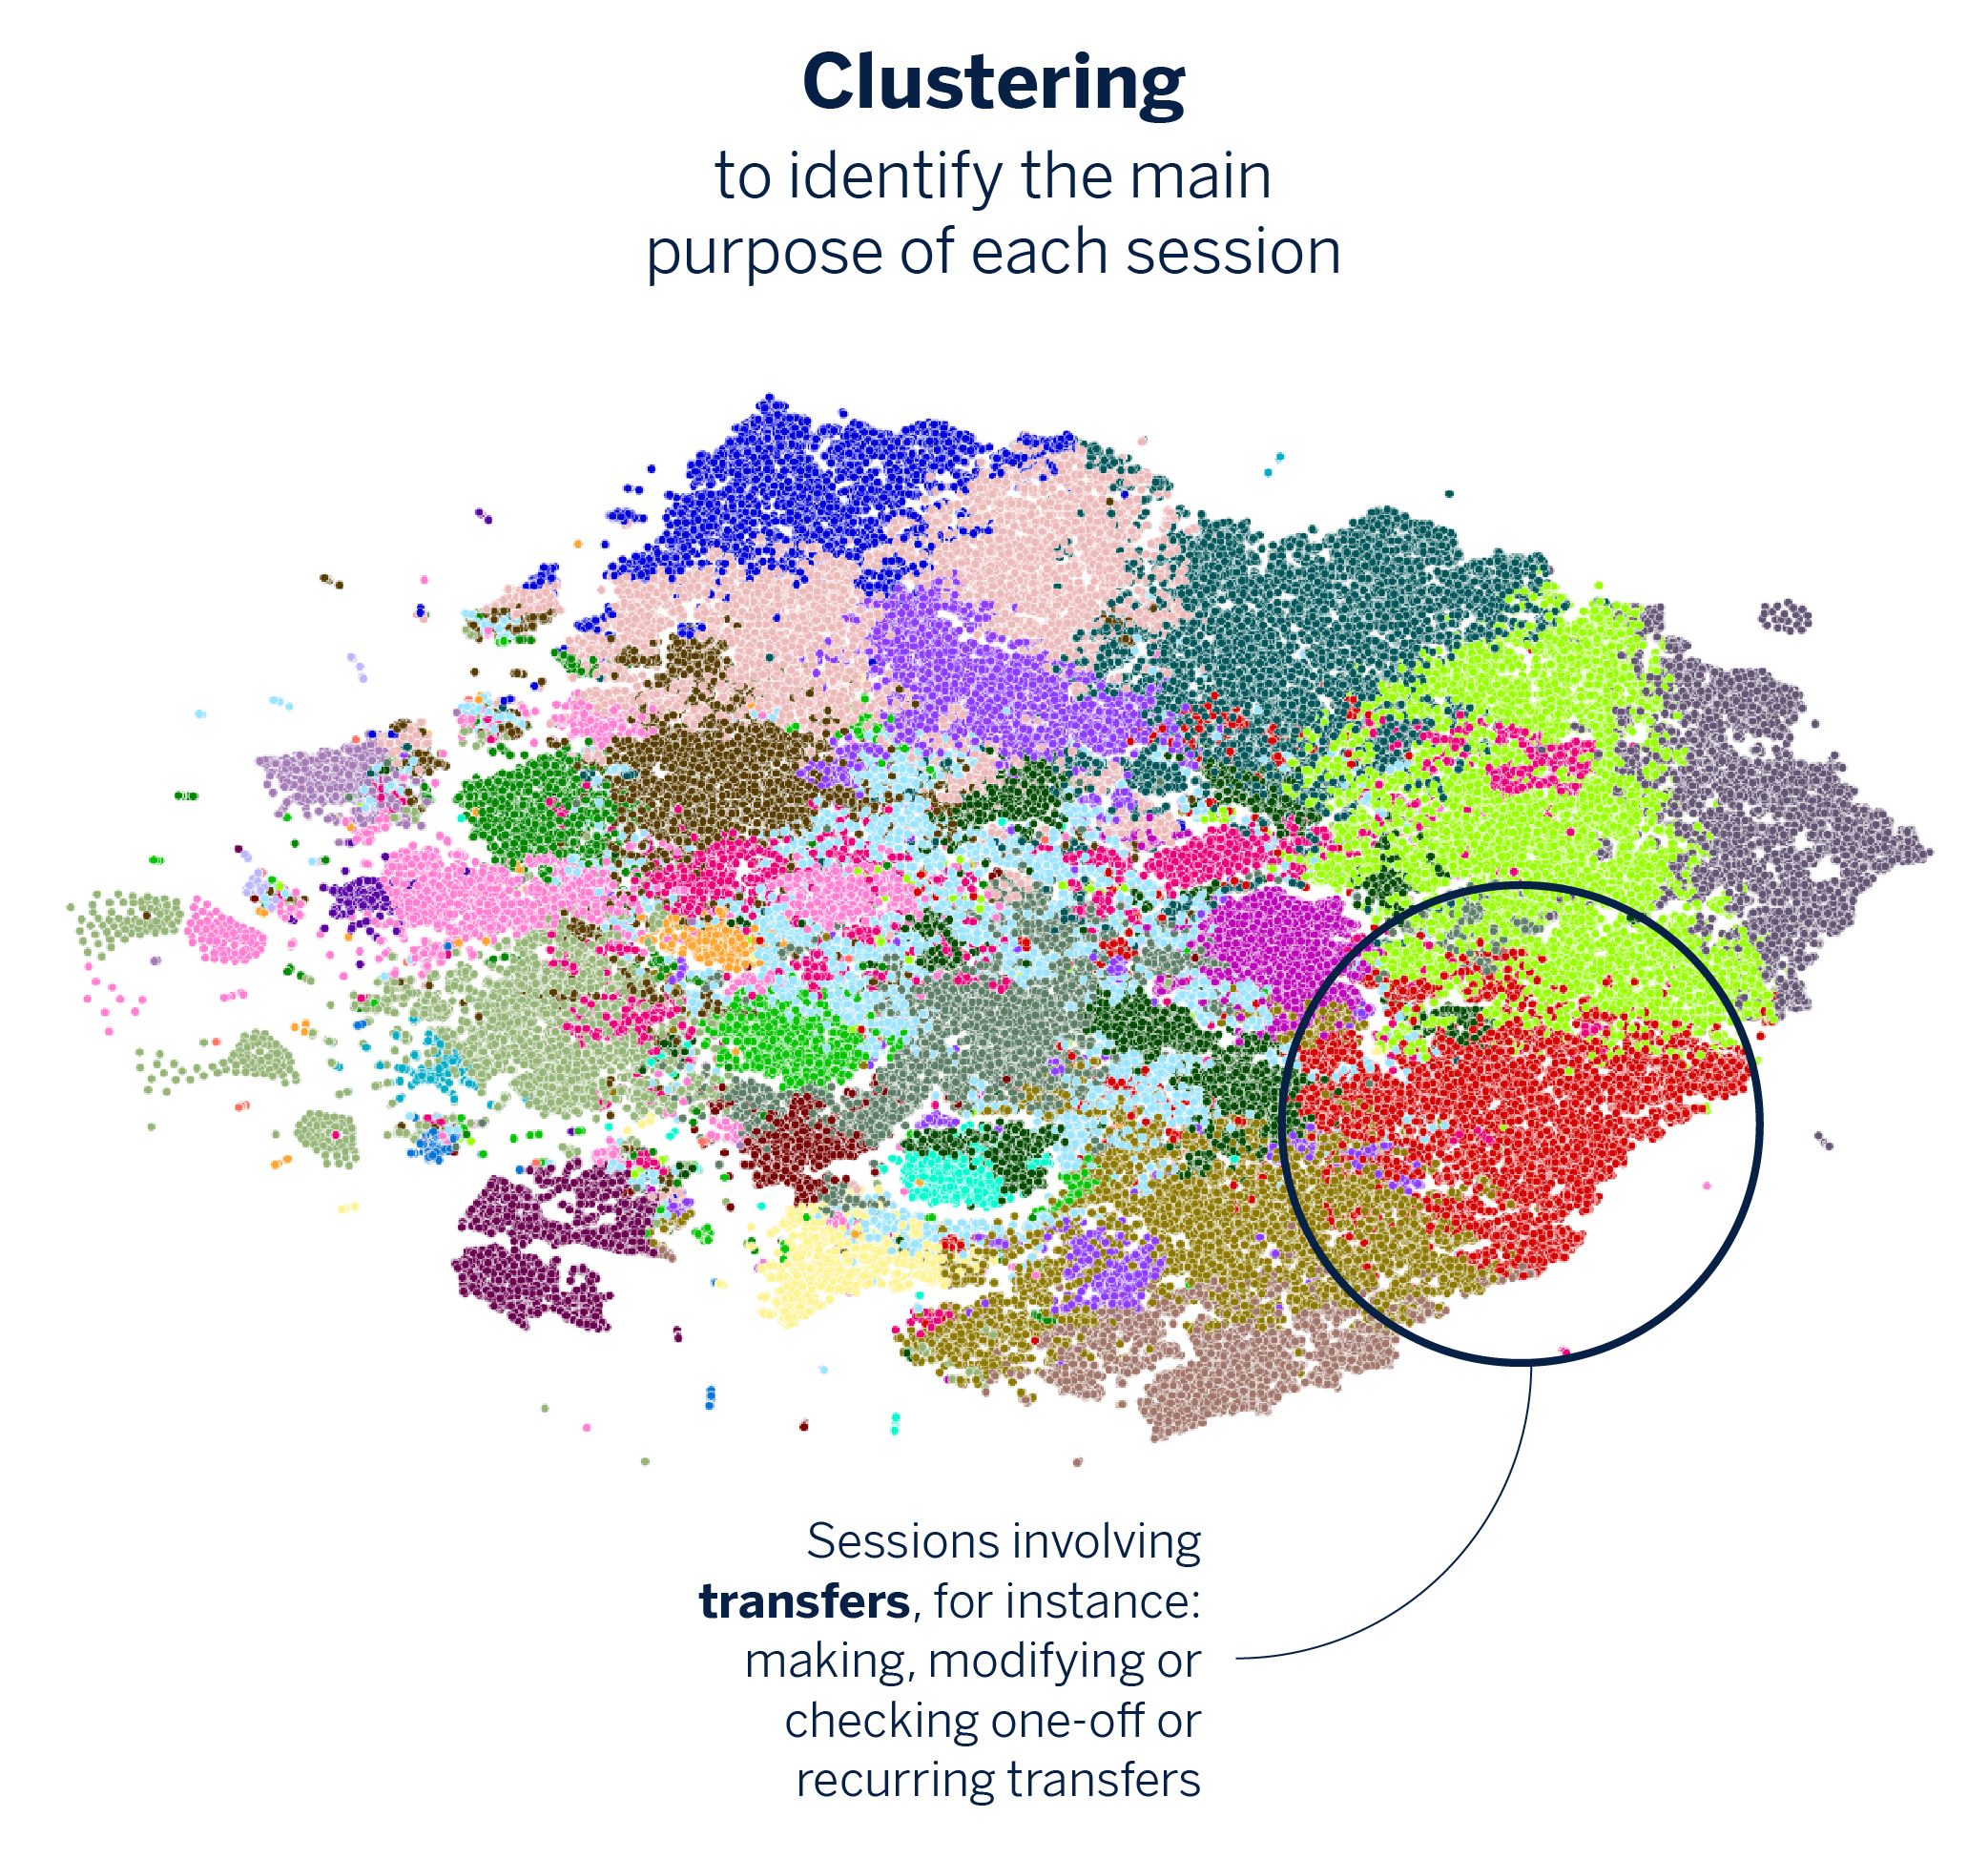
As discussed earlier, the embeddings we created capture the client’s navigation path through the app during a session. In this stage, we utilize clustering algorithms to organize the embeddings into groups, with each cluster symbolizing a similar action. This process enables us to identify and distinguish sessions based on their primary goal, whether it’s conducting a transfer or reviewing the account balance.
Client representation: From sessions to characterization
Next, we represent a user’s session information as a vector. This new vector reflects the clusters generated in the previous step and also includes the number of times the client engaged in each type of session. In this scenario, the dimensions of the vector become explainable because we can associate them with a specific session purpose, such as making a transfer or checking the account balance. Thus, we are no longer dealing with an “opaque” vector, but with a representation that we can easily understand.
This new vector is integrated into the propensity model, allowing us to evaluate its influence on the prediction. By implementing this change and removing the initial embedding (since its information is now incorporated into the new vector), the number of variables in the model totals 70.
Since each dimension of the vector represents an independent label, we can freely choose which variables to include in the model. This new representation enhances the model’s accuracy and, consequently, makes it easier to explain, as the variables are now self-explanatory and do not require complex analysis to understand their impact.
Conclusions and takeaways on enhancing our models with browsing data
Integrating embeddings and navigation tags into the model leads to enhanced AUC and overall performance. The launch of NavTagger significantly clarifies and standardizes variable interpretation, as the embedding dimensions now align with specific customer intents, simplifying the communication of results to the business unit. Below are several key lessons learned:
01: High dimensionality can be a problem
Embeddings provide a way to compress information, enabling us to represent complex data in a vector space where we can work with it effectively. However, this representation often involves high dimensionality. This can pose a challenge, as it may require substantial computational resources and complicate convergence for certain models.
02: Embeddings’ reusable and adaptable nature can assist us
Once embeddings are calculated and trained, they can easily be applied to other projects or models without the need for repeated calculations. Additionally, embeddings offer significant flexibility and potential to adapt to different contexts.
03: The need for explainability persists
Justifying the results achieved poses a challenge, particularly when it comes to latent spaces where each dimension is abstract and hard to interpret. This issue can be alleviated by employing dimensionality reduction and clustering techniques, as demonstrated in this exercise.